
Figure 1. Microarray results.
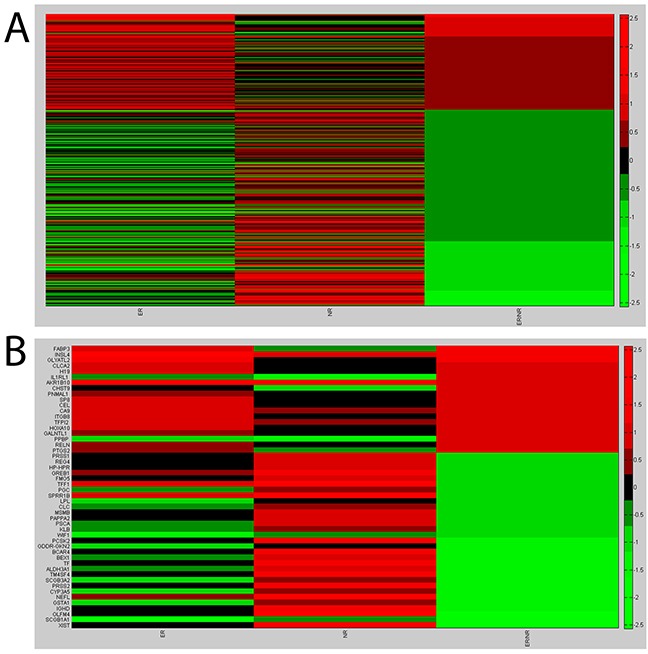
A. Heat map plot for gene expression ratio- the (log10) of ER vs Normal, NR vs Normal and ER vs NR. B. Heat map plot for the selected genes: lower (0.10) and upper (0.90) quartiles of the distribution of the logarithm of the fold of ER versus NR.