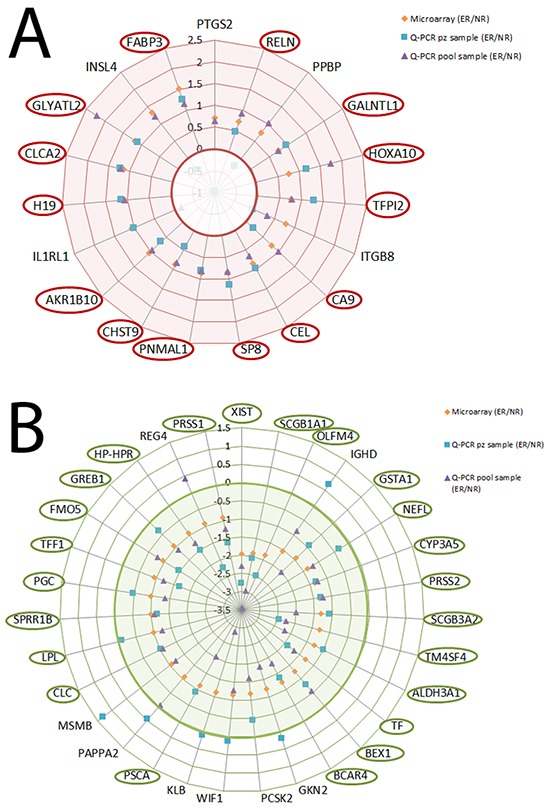
Figure 2. Validation experiments for the increased and decreased selected genes (orange diamond), Q-PCR pool (cyan square) and Q-PCR patients (violet triangle).

A. Logarithm of the ratio ER vs NR for the increased genes. B. Logarithm of the ratio ER vs NR for the decreased genes.
