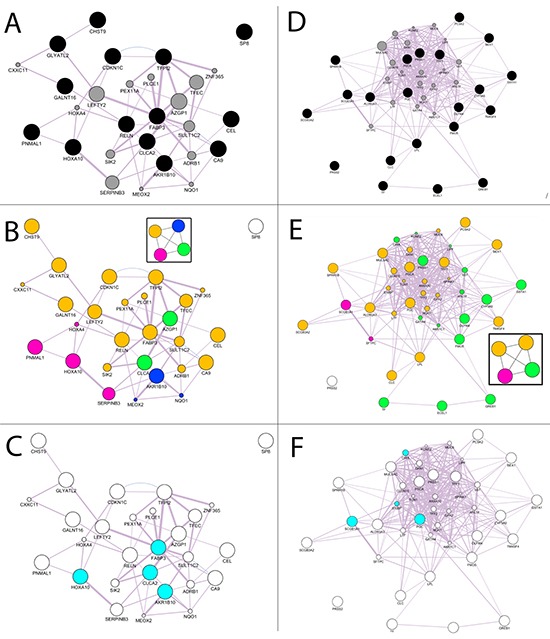
Figure 3. Computational analysis for increased and decreased genes.

A. GeneMANIA networks of validated genes B. Community Landscape Analysis obtained with ModuLand plug-in. The four modules were plotted in the graph using a different color for each groupof nodes in the same module. C. Key nodes that predict the function of all four modules. D. GeneMANIA networks of validated genes E. Community Landscape Analysis obtained with ModuLand plug-in. The five modules were plotted in the graph using a different color for each groupof nodes in the same module. F. Key nodes that predict the function of all five modules.
