
Figure 4. Box plots and Kaplan-Meier estimates for disease-free survival (DFS) for an independent patient population.
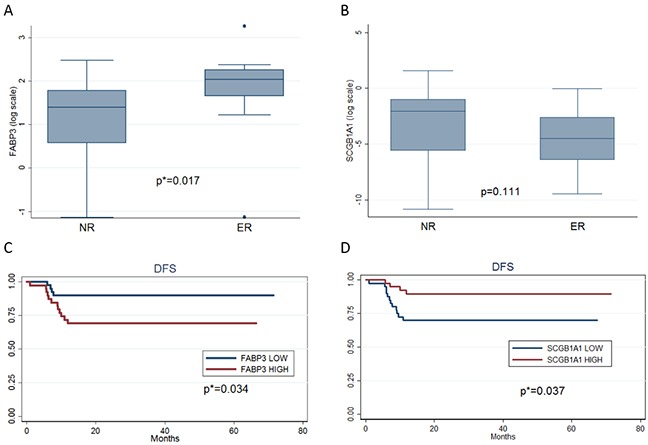
A. Box plot for the logarithm of FABP3 gene expression for NR and ER patients. B. Box plot for the logarithm of SCGB1A1 gene expression for NR and ER patients. C. Kaplan-Meier estimates for disease-free survival (DFS) according to lowand high FABP3 expression with respect to the mean of this gene expression in the study population. D. Kaplan-Meier estimates fordisease-free survival (DFS) according to low and high SCGB1A1 expression with respect to the mean of this gene expression in the studypopulation.