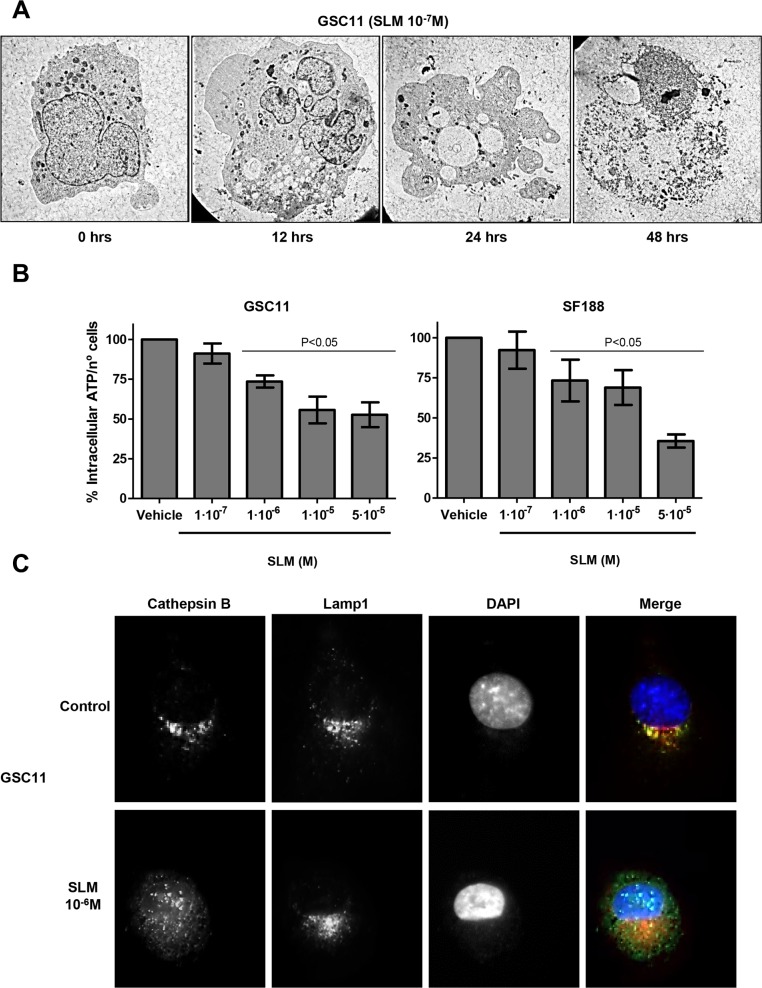
Figure 3. SLM induces necrosis.
(A) GSC11 cells were treated with SLM (10−7 M), and cells were collected 0, 12, 24 and 48 hours later. The micrographs shown are representative of the morphology of treated cells (× 1000 magnification). (B) GSC11 and SF188 cells were seeded at a density of 1 × 10⁵ cells per well in a 6-well plate. The following day cells were incubated with SLM and 48 hours later the levels of ATP were measured. Data are presented as the mean ± SD of three independent experiments. (C) GSC11 cells were incubated with SLM, at the indicated concentrations, and, 48 hours later, cathepsin B (green) and Lamp1 (red) localization were assessed with immunofluorescence. Representative images for three independent experiments are shown; DAPI (blue) was used for nuclear staining.

