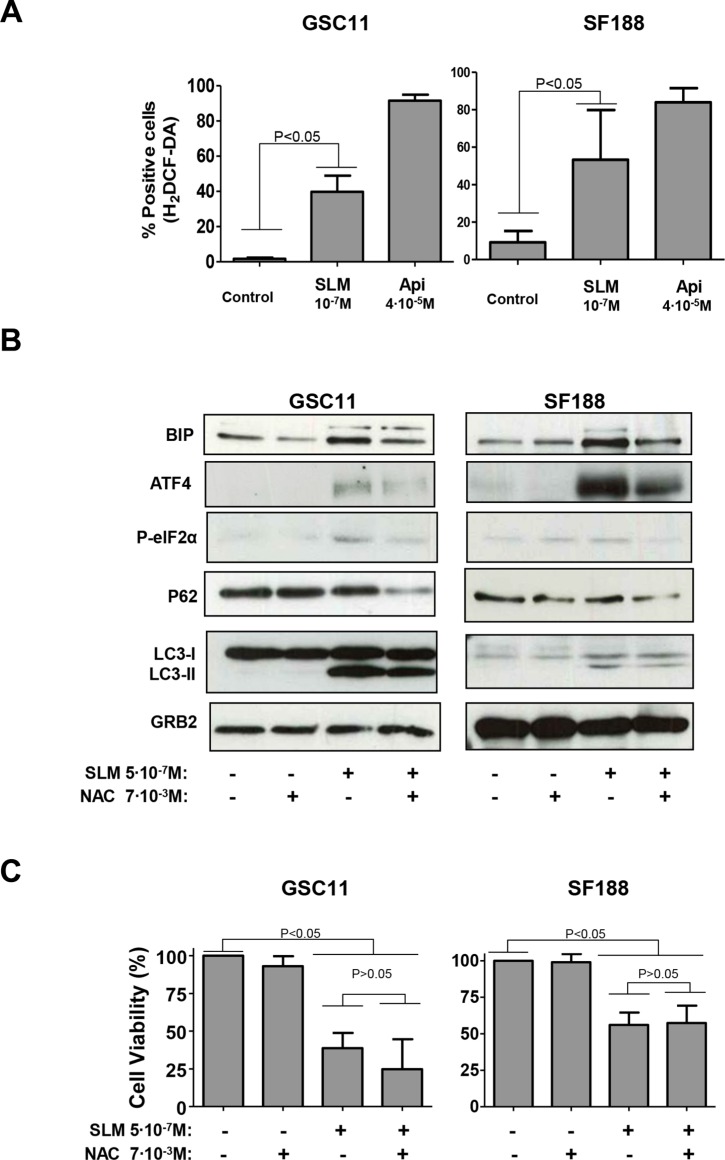
Figure 5. SLM treatment induced oxidative stress.
(A) GSC11 and SF188 cells were seeded at a density of 1 × 10⁵ cells per well in 6-well plates. Next day cells were incubated with SLM or Apigenine (Api; as a positive control) at the indicated concentrations. Cells were collected 48 hours later and stained with H2DCF-DA (4 μM). Cells were then analyzed by flow cytometry. (B) GSC11 and SF188 cells were seeded at a density of 1 × 10⁵ cells per well in a 6-well plate. The following day, cells were incubated with SLM, NAC or both drugs at indicated doses. Cells were harvested three days later, and protein samples were analyzed by western blot for BIP, ATF4, P-elF2α, p62 and LC3-II conversion. GRB2 was used as loading control. Shown is a representative western blot of three independent experiments. (C) GSC11 and SF188 cells were seeded at a density of 1 × 10⁵ cells per well in a 6-well plate. The following day cells were incubated with SLM, NAC or both drugs at the indicated doses. Three days later cells were counted in a Neubauer chamber. The results are represented as the percentage of cell viability relative to non-treated cells; the mean ± SD from three independent experiments is shown.

