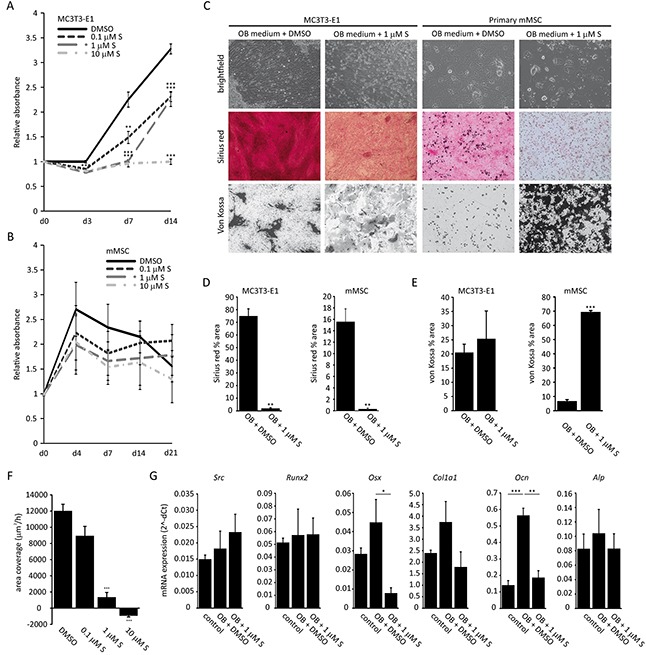
Figure 3. Effect of saracatinib on osteoblast function.

A. MTT assay on MC3T3-E1 cells incubated with a range of saracatinib concentrations (n=3 experiments, **: p<0.01, ***:p<0.001 compared to DMSO-treated control cultures). B. MTT assay on primary murine MSCs (mMSC) incubated with a range of saracatinib concentrations (n=3 experiments, no significant differences compared to DMSO-treated control cultures). C. Representative brightfield (200x magnification), Sirius red staining and von Kossa staining images (40x magnification) on MC3T3-E1 and mMSCs cultured in osteoblast differentiation medium (OB medium) with or without saracatinib (S). D. Quantification of Sirius red staining (percentage area) in osteoblast cultures (n=3 experiments, **: p<0.01). E. Quantification of von Kossa staining (percentage area) in osteoblast cultures (n=3 experiments, ***: p<0.001). F. Migration rates of MC3T3-E1 cells treated with a saracatinib (S) (n=3 experiments, ***: p<0.001). G. mRNA expression levels of MC3T3-E1 osteoblast markers determined by qPCR. Controls represent cultures in standard medium. (n=3 experiments, *: p<.0.05, **: p<0.01, ***: p<0.001). All data are represented as mean +/− standard error.
