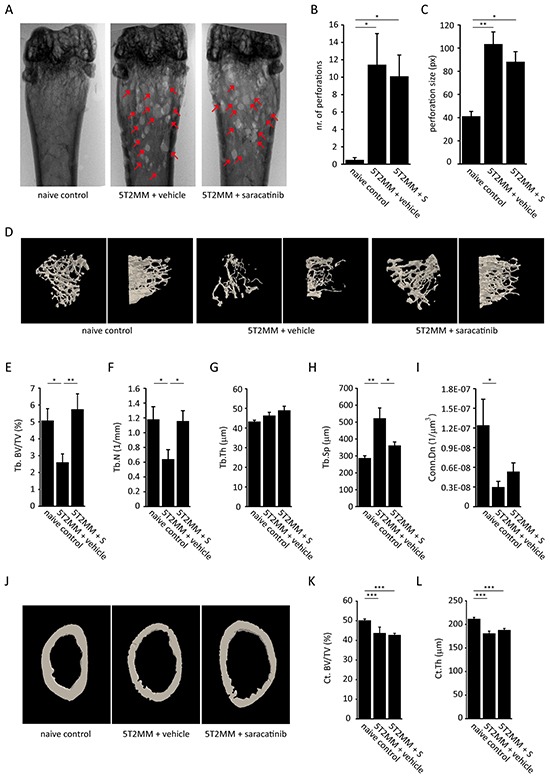
Figure 6. Effect of saracatinib treatment on the development of bone disease in the 5T2MM multiple myeloma model.

A. Representative distal femur radiographs of naive control mice, vehicle-treated myeloma-bearing mice and saracatinib (S)-treated myeloma-bearing mice. Red arrows indicate cortical perforations. B. Quantification of the number of cortical perforations (n=8/12/10 bones, *: p<.0.05). C. Quantification of perforation size (n=8/12/10 bones, *: p<.0.05, **: p<0.01). D. Representative reconstructed 3D-models of trabecular bone of the proximal tibia in naive control mice, vehicle-treated mice and saracatinib-treated mice. Left panels show a top-down view, right panels show a lateral view. E. Trabecular bone volume (Tb.BV/TV), F. trabecular number (Tb.N), G. trabecular thickness (Tb.Th), H. trabecular separation (Tb.Sp) and I. connectivity density (Conn.Dn) as determined by μCT morphometric analysis on proximal tibiae (n=8/12/10 bones, *: p<.0.05, **: p<0.01). J. Representative reconstructed 3D-models of cortical bone of the distal femur in naive control mice, vehicle-treated mice and saracatinib-treated mice. K. Cortical bone volume (Ct. Bv/TV) and L. cortical thickness (Ct.Th) as determined by μCT morphometric analysis on distal femurs (n=8/12/10 bones, ***: p<0.001). All data are represented as mean +/− standard error.
