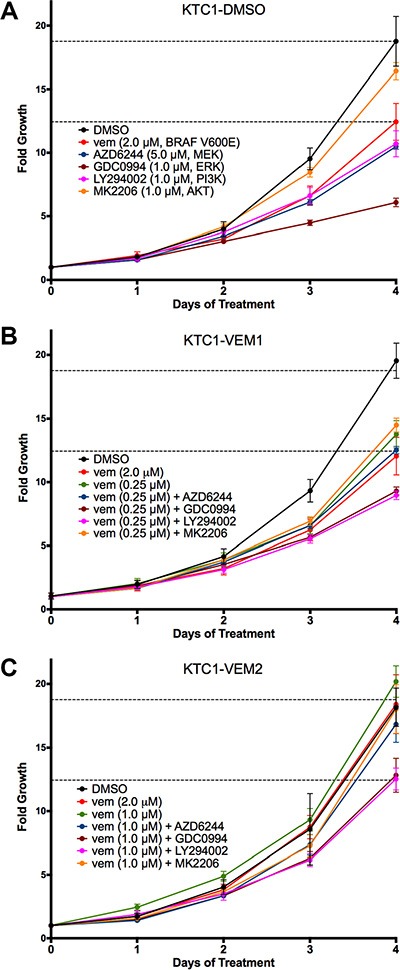
Figure 3. Four-day growth curves performed on KTC1 subpopulations (A) KTC1-DMSO; (B) KTC1-VEM1; (C) KTC1-VEM2) with and without PI3K/AKT and RAF/MEK/ERK pathway inhibitors.

Cells were treated on day 0 with either no inhibitor (DMSO only), vemurafenib alone (2.0 μM), the vemurafenib concentration each subpopulation was exposed to during long-term passaging (KTC1-DMSO, none; KTC1-VEM1, 0.25 μM; and KTC1-VEM2, 1.0 μM), or vemurafenib in combination with kinase inhibitors for AKT (1.0 μM MK2206), PI3K (1.0 μM LY294002), MEK (5.0 μM AZD6244), and ERK1/2 (1.0 μM GDC0994). Points represent fold growth each day of treatment normalized to cell number counted just prior to treatments for each subpopulation. Dotted lines represent DMSO and 2.0 μM vemurafenib treatments of the KTC1-DMSO cells on each figure.
