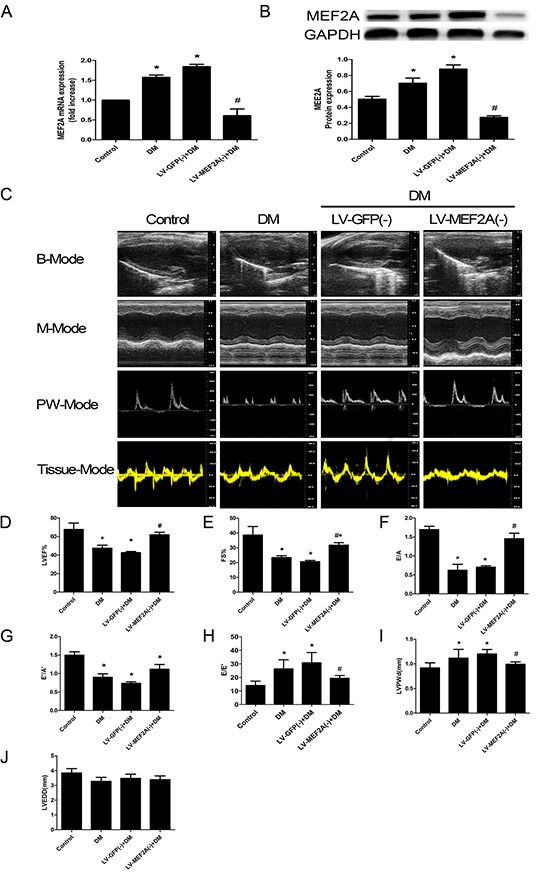
Figure 1. MEF2A expression and Echocardiography measurements of mouse hearts.

A. Quantitative RT-PCR analysis of MEF2A mRNA expression; B. Western blot analysis of MEF2A in hearts from all groups; C. Typical echocardiographic images of 2D echocardiograms, M-mode echocardiograms, pulsed-wave Doppler echocardiograms and tissue Doppler echocardiograms in all groups; D–J. Quantitative analysis of echocardiographic measurements parameters. (D) Left ventricular ejection fraction (LVEF). (E) Fractional shortening (FS). (F) Early to late mitral flow (E/A). (G) Early to late ratio of diastolic mitral annulus velocities (E'/A'). (H) Early mitral flow ratio to tissue Doppler-derived early mitral annulus velocity (E/E'). (I) Left ventricular posterior wall thickness at diastole (LVPWd). (J) Left ventricular end-diastolic dimension (LVEDD). Data are mean±SEM. *p<0.05 compared with control; # p<0.05 compared with vehicle treatment group. n= 8 to 10 mice for each group.
