
Figure 2. MEF2A inhibition limits diabetes-induced myocardial fibrosis.
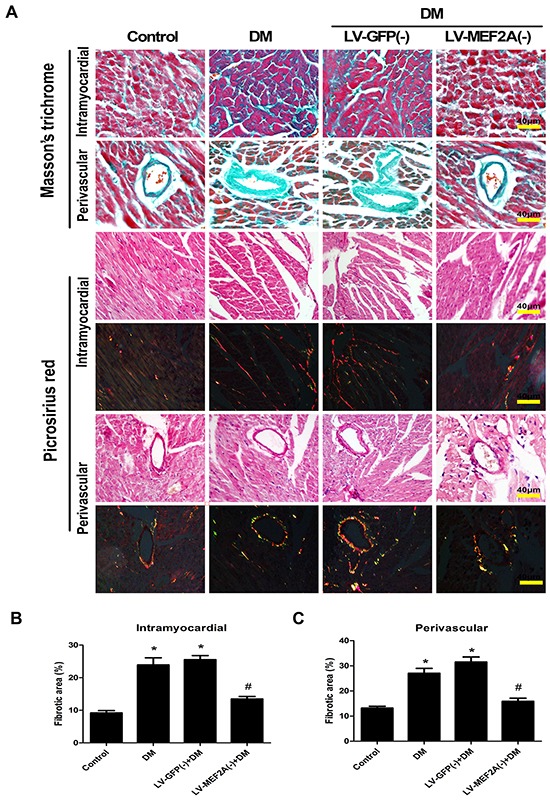
A. Interstitial and perivascular fibrosis were analyzed by Masson's trichrome (blue staining) and Picrosirius Red staining (red and yellow staining) after 20 weeks of diabetes mellitus in all groups mouse. Scale bars=40 μm. B. Quantification of interstitial fibrosis after 20 weeks of diabetes mellitus. C. Quantification of perivascular fibrosis after 20 weeks of diabetes mellitus. Data are mean±SEM. *p<0.05 compared with control; # p<0.05 compared with vehicle treatment group. n= 8 mice for each group.