
Figure 1. Effect of GpS on the intestinal polyp formation in the ApcMin/+ mice.
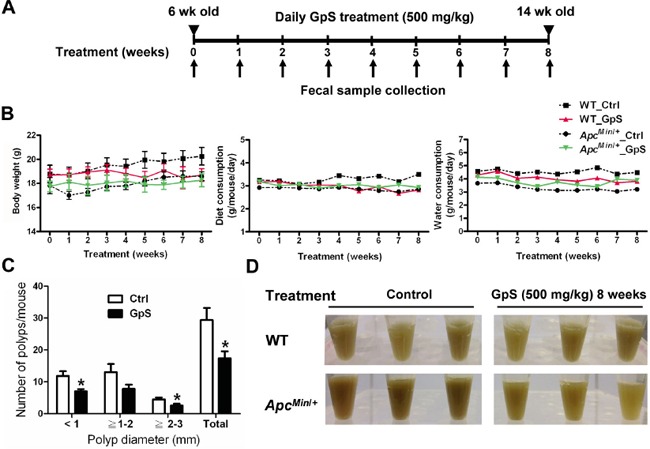
A. Schematic diagram of experimental design. B. The profiles of body weight, diet and water consumption. C. Effect of GpS on the size distribution of polyps. Data is presented as the mean ± SEM (* P < 0.05 versus control); n=6/group. D. Display of the fecal extracts of the WT and ApcMin/+ mice with or without GpS treatment for 8 weeks.