
Figure 2. Comparison of microbial composition between the control and GpS-treated WT and ApcMin/+ mice.
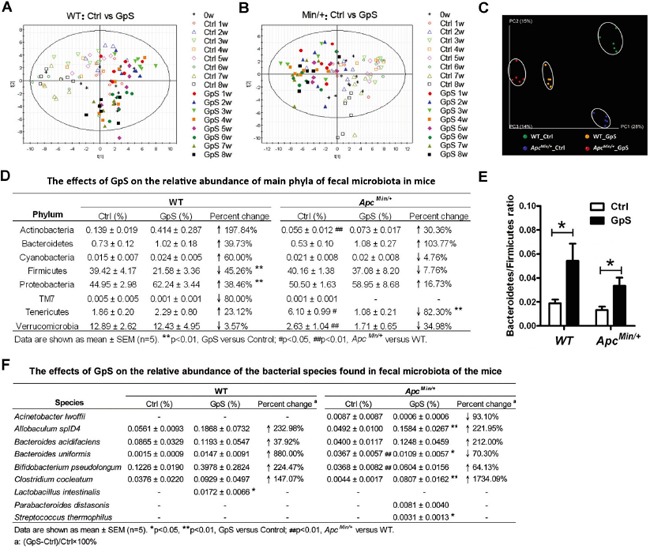
A & B. The time course PLS-DA plots of ERIC-PCR DNA profile of WT (see A) and ApcMin/+ (see B) mice treated and untreated with GpS. Open symbols: control mice; Solid symbols: GpS-treated mice (n=6/group). Fecal genomic DNA was subjected to ERIC-PCR, and the gel pictures were digitized by Image Lab 3.0 system (Bio-Rad). Based on the distance and the intensity of each DNA bands, SIMCA-P 12.0 tool was applied to obtain the PLS-DA score plots. C-E. 16S pyrosequencing analysis on the fecal genomic DNA samples from the WT and ApcMin/+ mice with or without GpS treatment for 8 weeks (n=5/group). C. PCoA plots of all samples from different treatment groups. The data were analyzed using QIIME software with the workflow script. PCoA plots were then generated using the unweighted UniFrac distance metric. D. The effects of GpS on the relative abundance of main phyla of fecal microbiota in mice. Beta diversity was calculated by QIIME software. E. Bacteroidetes/Firmicutes ratio. Data is presented as the mean ± SEM (* P < 0.05, GpS versus control). F. The effects of GpS on the relative abundance of the bacterial species found in fecal microbiota of the mice.