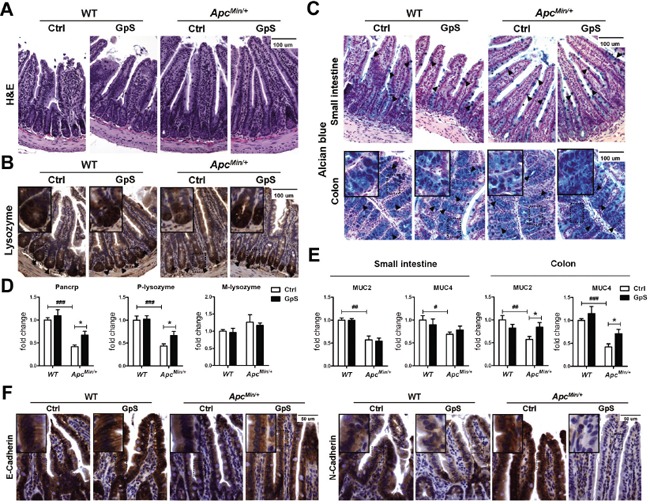
Figure 4. Effects of GpS on the intestinal epithelium.

Intestinal tissues were collected after 8 weeks of treatment with or without GpS from the WT and ApcMin/+ mice. A. H&E staining. B. IHC staining of Paneth cells. C. Alcian blue staining of goblet cells. Hematoxylin and eosin (H&E) staining was used to visualize the formalin-fixed sections of small intestine. IHC staining of lysozyme was applied to identify the Paneth cells in the small intestine, and the dark brown at the bottom of the intestinal crypts indicates the presence of Paneth cells. Alcian blue staining was used to identify the goblet cells, and the blue staining indicates the presence of the goblet cells. D & E. The relative mRNA expression of Paneth cells related antimicrobial peptide (see D) and goblet cells related mucins (see E) was evaluated by qRT-PCR in the intestinal mucosal samples. Data was normalized to the expression of reference gene, and expressed as fold change of the WT control group. Data is presented as the mean ± SEM (* P < 0.05, GpS versus control samples; ## P < 0.01, ### P < 0.001, ApcMin/+ versus WT control samples); n=6/group. F. IHC staining of E-cadherin and N-cadherin. Positive expression is indicated by the brown color staining. Nuclear is stained and appeared in blue color that was done by hematoxylin staining.
