
Figure 7. Effects of GpS on the macrophage phenotypic polarization.
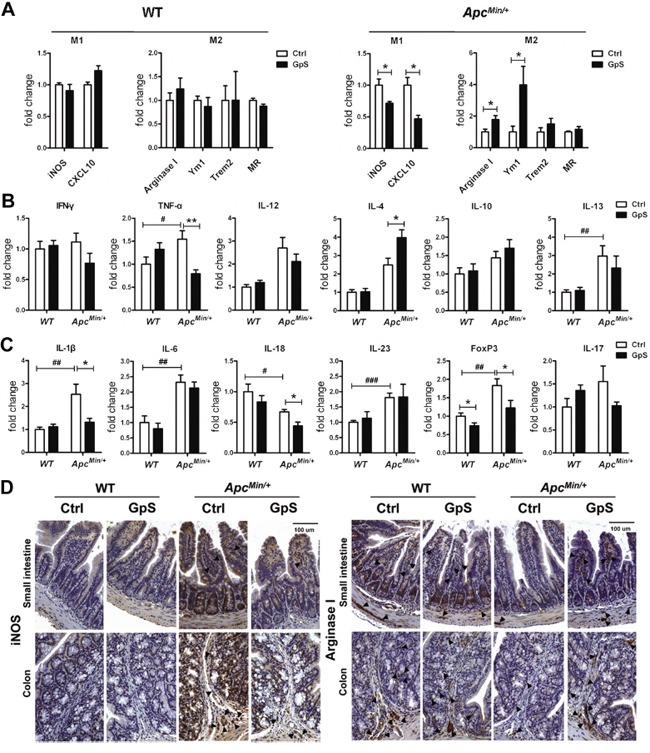
A. The relative mRNA expression of M1 and M2 macrophage markers. qRT-PCR analysis of mRNA extracted from the mucosal lysates of experimental mice were performed with specific primers. Data was normalized to the expression of reference gene, and expressed as fold change of the untreated group. B & C. The relative mRNA expression of (see B) macrophage polarization related cytokines and (see C) inflammation related molecules. Data was normalized to the expression of reference gene, and expressed as fold change relative to the WT control group. Data is presented as the mean ± SEM (* P < 0.05, ** P < 0.01 GpS versus control samples; # P < 0.05, ## P < 0.01, ### P < 0.001, ApcMin/+ versus WT control samples); n=6/group. D. IHC staining of iNOS and Arginase I. Arrows indicate the representative staining of the positive cells.