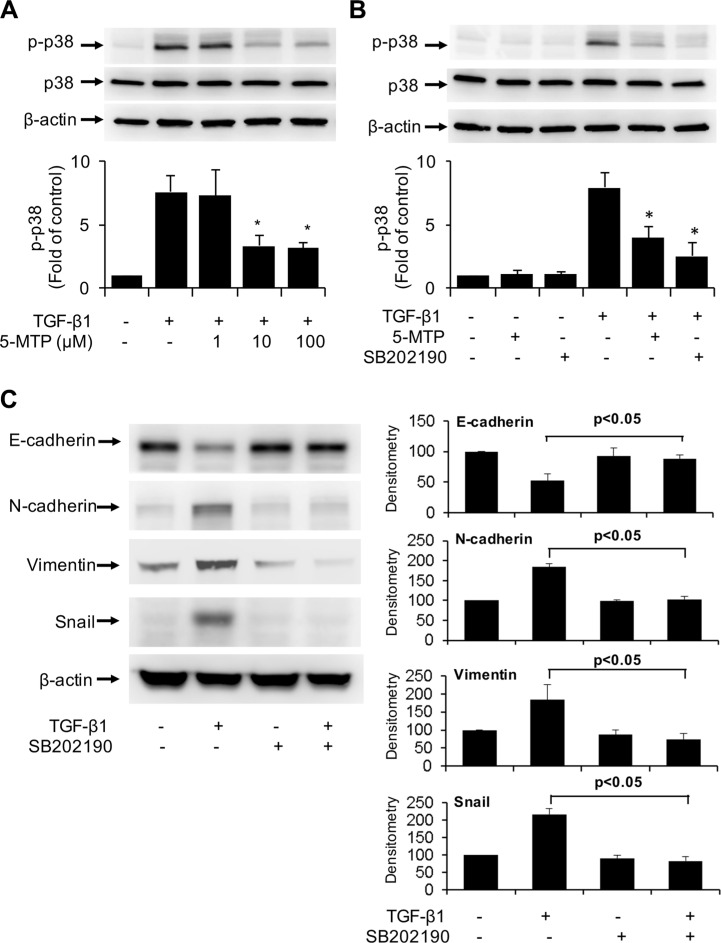
Figure 5. Inactivation of TGF-β1-induced p38 MAPK by 5-MTP.
(A) and (B) A549 cells were pretreated with 5-MTP at increasing concentrations (A) or 10 μM (B) or SB202190 (10 μM) for 30 min followed by TGF-β1 for 15 min. Cells were lysed and p-p38 MAPK (p-p38) and total p38 MAPK (p38) were analyzed by Western blotting. Upper panels show representative blots and lower panels the densitometry of p-p38 blots. Error bars denote mean ± SEM (n = 3). * indicates P < 0.05 compared to TGF-β1 alone. (C) A549 cells were pretreated with SB202190 for 30 min followed by TGF-β1 for 48 h. EMT markers in the cell lysates were analyzed by Western blotting. The left panel shows representative blots and the right panel the densitometry. Error bars denote mean ± SEM (n = 3).

