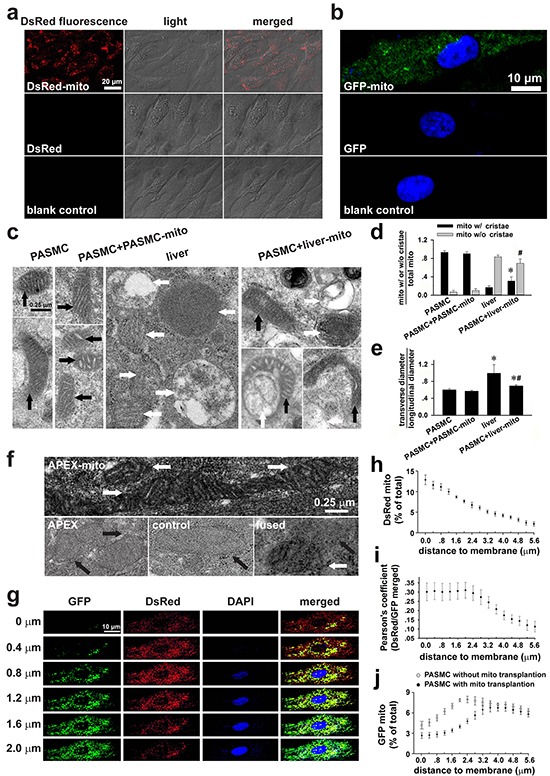
Figure 1. Transplantation of exogenous mitochondria into PASMCs in culture.

a. Live cell confocal imagings of PASMCs after incubation with DsRed-labeled mitochondria (prepared from PASMC, upper), DsRed (middle) or vehicle (lower, n=3). b. Indirect immunofluorescent-stainings of the fixed PASMCs after incubation with GFP-labeled mitochondria (prepared from PASMC, upper and lower), GFP (middle) with (upper and middle) or without antibody against GFP (lower, n=3). c-e. Electron micrographs (EM) showing long spindle mitochondria with clear cristae in control PASMCs and PASMCs incubated with PASMC-derived mitochondria (PASMC-mito) (black arrows, left, c), round mitochondria with swelling, unclear cristae in Wilson's rat liver cells (white arrows, middle, c), mixture of mitochondria with distinct morphology in PASMCs after incubation with the liver mitochondria (liver-mito) (black and white arrows, right, c) and quantitative comparisons of two shapes of mitochondria (* # p < 0.05 vs. mito with/without cristae in PASMCs respectively, d). as well as the ratio of width to length of mitochondria (*p < 0.05 vs. PASMCs, #p < 0.05 vs. liver, e). Quantitation obtained from 58, 124, 232 and 73 mitochondria of 12, 11, 20 and 11 cells for control PASMCs, PASMCs incubated with PASMC-mito, liver cells and PASMCs incubated with liver-mito, respectively. f. The representative images showing apparent EM contrast only in the mitochondrial matrix, not the intermembrane space in PASMCs after transplantation of APEX-labeled mitochondria (white arrows, upper), no EM contrast in mitochondria in PASMCs with incubation of APEX (black arrows, left, lower) or in control PASMCs without transplantation of APEX-labeled mitochondria (black arrows, middle, lower), and the mixture/fusion of exogenous mitochondria with EM contrast and endogenous counterpart without EM contrast in the PASMCs after transplantation of APEX-labeled mitochondria (white and black arrows, right, lower) (n=3 for each). g-j. Continuous confocal scannings of DsRed-labeled mitochondria transplanted into PASMC with GFP-labeled endogenous mitochondria (g, the distance away from cell surface shown on the left of each panel), quantitative distributions of DsRed-mitochondria by the distance to cell membrane (h), Pearson's coefficient showing co-localizations of DsRed- and GFP-mitochondria by the distance to cell membrane (i) and distribution of GFP-labeled endogenous mitochondria by the distance to cell membrane in PASMCs with transplantation of DsRed-labeled exogenous mitochondria versus those in PASMCs without transplantation of exogenous mitochondria (j) (n=6 for g-j).
