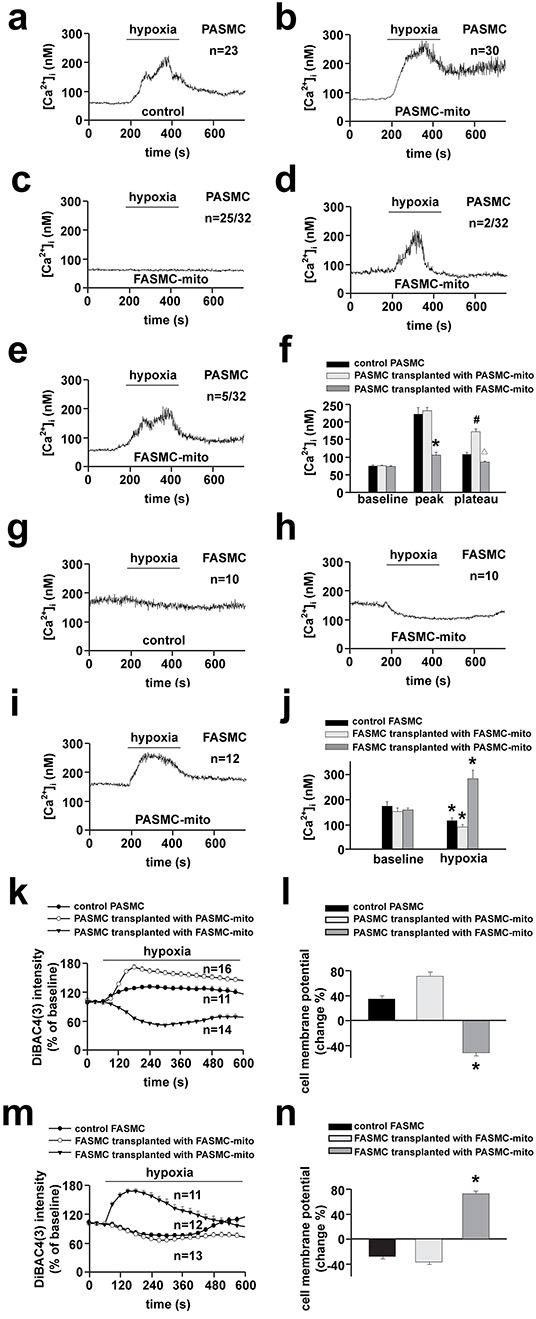
Figure 4. Changes of hypoxia-altered [Ca2+]i and cell membrane potential in native SMCs by transplanted mitochondria.

a-j. Representative curves of hypoxia-triggered [Ca2+]i responses in a control PASMC (a), PASMC transplanted with PASMC-mito (b) or FASMC-mito (c-e) and summary of a-e (* # Δ p < 0.05 vs. control, f); in a control FASMC (g), FASMC transplanted with FASMC-mito (h) or PASMC-mito (i) and summary of g-i (*p < 0.05 vs. baseline, j) k-n. Representative curves of hypoxia-triggered cell membrane potential response in a control PASMC, PASMC transplanted with PASMC-mito or FASMC-mito (k) and summary of maximal alterations of cell membrane potential (l); in a control FASMC, FASMC transplanted with FASMC-mito or PASMC-mito (m) and the summary (n). “n” indicated the cell number examined for each group.
