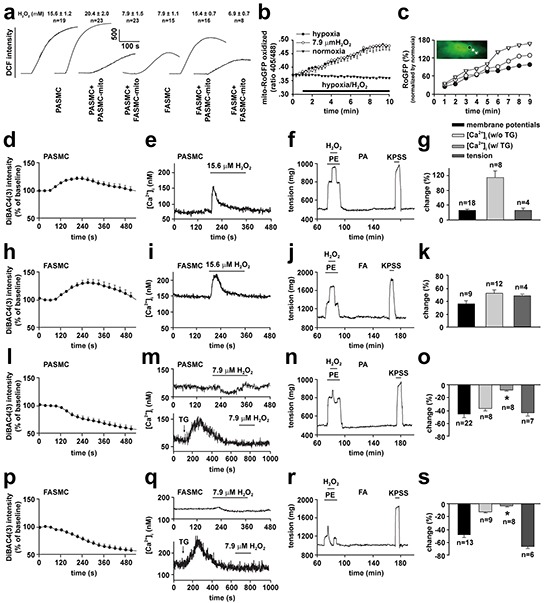
Figure 7. Dose-dependent alterations in cell membrane potential, [Ca2+]i and vascular tension in exposure to H2O2.

a-c. ROS generation in hypoxia-exposed pulmonary (PASMCs) and femoral artery smooth muscle cells (FASMCs). Representative alterations of DCFDA intensity in PASMCs and FASMCs in exposure to hypoxia and calibrated H2O2 levels (a). Quantified time-course changes in RoGFP intensity ratios from excitation of 405 nm versus 488 nm with emission of 515 nm from FASMCs exposed to hypoxia, 7.9 μM H2O2 or normoxia (n= 4 for each, b). (c). Representative and quantitative estimation of localized alterations of cytosol RoGFP fluorescence in the area close to cell membrane, the middle and the one close to nucleus from a PASMC upon exposure to hypoxia (n=3 for each, c). d-s. Representative curves and averaged changes of DiBAC4 (3) fluorescence for cell membrane potential, fura-2 fluorescence for [Ca2+]i in smooth muscle cells and tension of artery rings in response to 15.6 μM (d-k) or 7.9 μM H2O2 (l-s) in PASMCs (d, e, g and l, m, o) and pulmonary artery (PA, f-g and n-o), or in FASMCs (h, i, k and p, q, s) and femoral artery (FA, j-k and r-s); in PASMCs without or with treatment of 1 μM TG (upper and lower, m), or in FASMCs without or with treatment of 1 μM TG (upper and lower, q). The changes of membrane potential and [Ca2+]i were compared with their baseline, respectively and the tension were normalized by the response induced by 80 mM K+ (KPSS), while “n” indicating the number of separate experiments for each.
