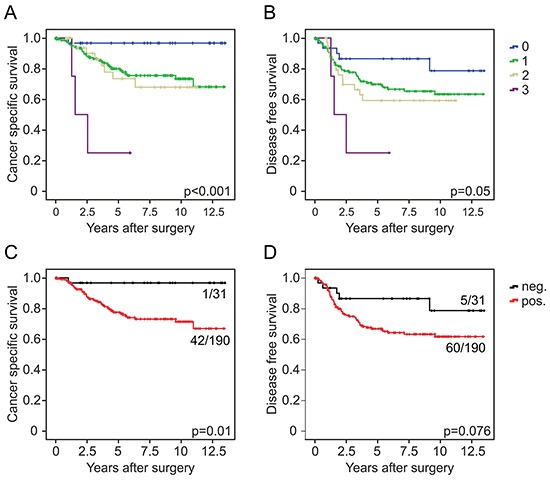
Figure 5. CYB5R1 indicates poor survival in colorectal cancer.

Kaplan-Meier plots for different CYB5R1 expression scores for tumor specific survival A. and disease free survival B. indicate significant poorer outcome with increasing CYB5R1 expression. Results for dichotomal CYB5R1 expression (negative and positive) are shown in C. and D. Significance p-values indicate log-rank test results. Ratios on curves indicate the number of events over the number of patients per group.
