
Figure 6. CYB5R1 mRNA expression and survival in colon cancer data from the TCGA.
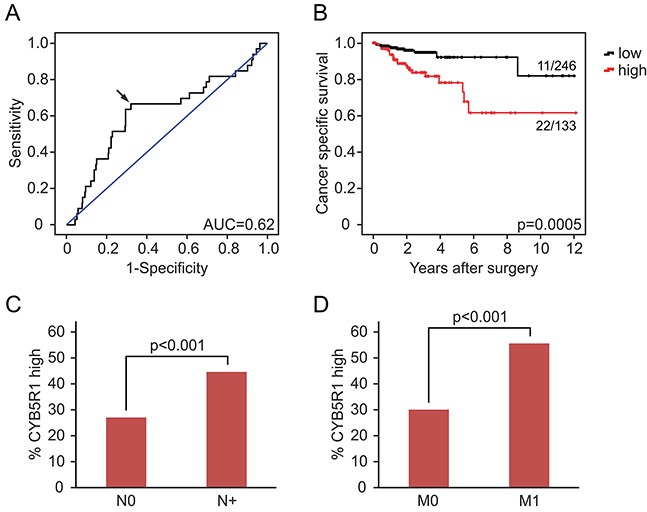
A. ROC curve for determining best discrimination thresholds of CYB5R1 mRNA reads for survival prediction. Arrow indicates chosen value for binary classification. AUC=Area under curve. B. Kaplan-Meier statistics for binary (low and high) classified CYB5R1 expression indicate shorter tumor specific survival for CYB5R1 high. Significance p-values indicate log-rank test results. Ratios on curves indicate the number of events over the number of patients per group. C, D. Cases with high CYB5R1 expression are significantly (t-test) more frequent among cases with lymph node metastasis (N+, C) and distant metastasis (M1, D), when compared to cases with low CYB5R1 expression.