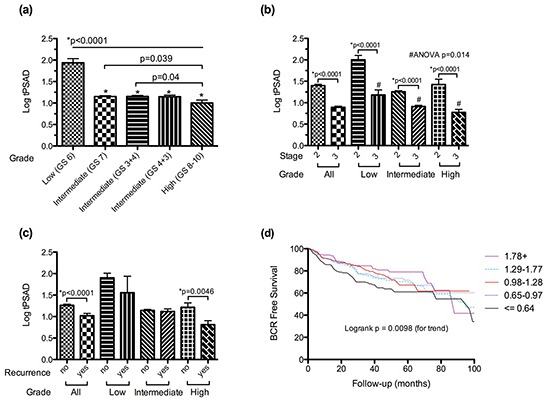
Figure 3.

Changes in log transformed PSA per unit total tumour volume (tPSAD) with increasing a. tumour grade, b. pathological stage and c. the development of biochemical recurrence, stratified by tumour grade. d. Kaplan-Meier curve of biochemical recurrence (BCR) free survival stratified by PSA per unit tumour volume (log transformed) quintiles. Data is presented as means + SEM.
