
Figure 2. Effects of ART, DHA, and ARTS on cell migration and invasion.
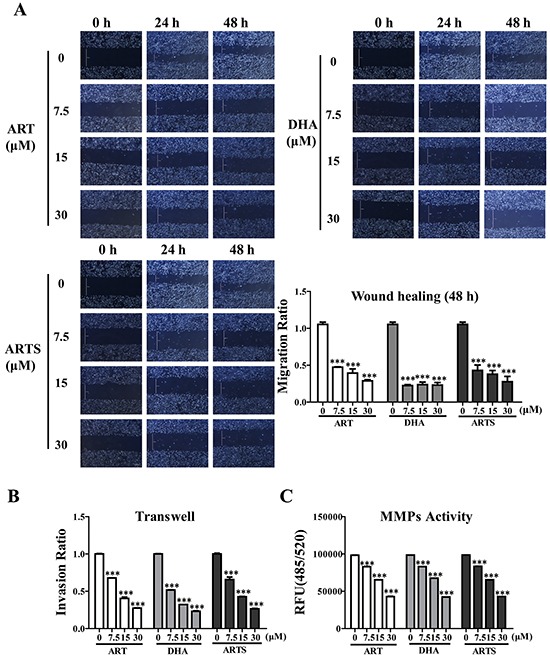
A. Representative photomicrographs of initial and final wounds at 24 and 48 h were shown at 100× magnification. Cell migration distance data were presented as the means ± SD of three independent experiments. B. Cell invasion data in A549 cell line shown were the means ± SD. C. Inhibitory effects of ART, DHA, and ARTS on MMPs activities were shown. Each bar was representative of the mean ± SD. (***p < 0.001, compared with the control group).