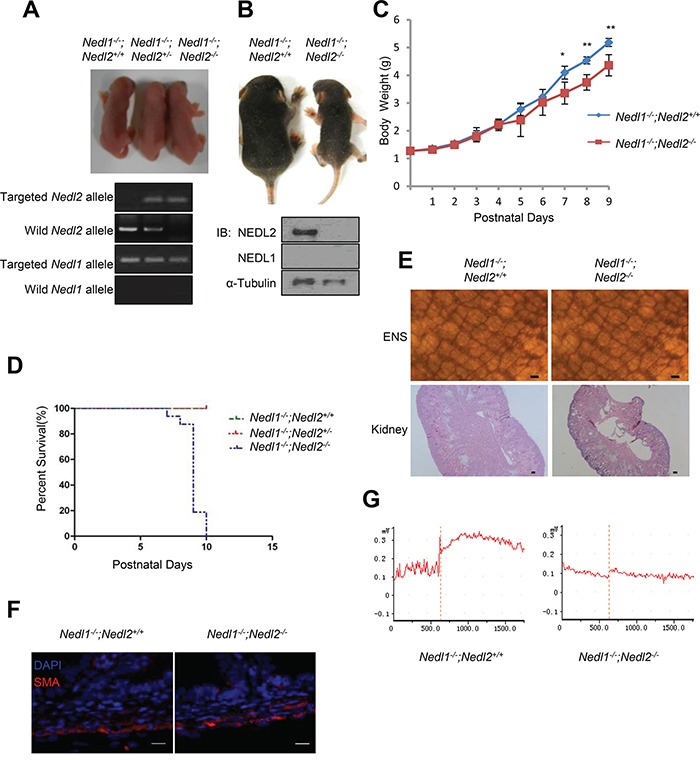
Figure 3. The phenotype of Nedl1−/−;Nedl2−/− mice.

A. Gross morphology of postnatal day 0 (P0) pups. B. Photograph of 9-days-old Nedl1−/−;Nedl2−/− mice littermate mice. C. Nedl1−/−;Nedl2−/− mice gain less body weight than Nedl1−/−;Nedl2+/+ littermates despite male or female. Nedl1−/−;Nedl2+/+, (n=8); Nedl1−/−;Nedl2−/−: (n=5-8), for all time points measured. D. Postnatal lethality phenotype in Nedl1−/−;Nedl2−/− mice. Survival curve for Nedl1−/−;Nedl2+/+(n=42), Nedl1−/−;Nedl2+/− (n=21) and Nedl2−/− mice (n=16) that overcome neonatal death. E. ENS system detected by AChE-staining (upper panel) and HE staining of kidneys (lower panel) from 9-day-old Nedl1−/−;Nedl2+/+ mice and Nedl1−/−; Nedl2−/− mice showed that there were obvious defects in ENS and kidney. Scale bar: 50 μm. F. Immunohistochemistry using anti-smooth muscle α-actin (SMA) antibody showed normal thickness of the smooth muscle layer in Nedl1−/−;Nedl2+/+ mice and Nedl1−/−;Nedl2−/− mice. Scale bar: 20 μm. G. Recording of intestine contraction force in response to 10 mM carbachol (CCh). Time periods are indicated during CCh treatment.
