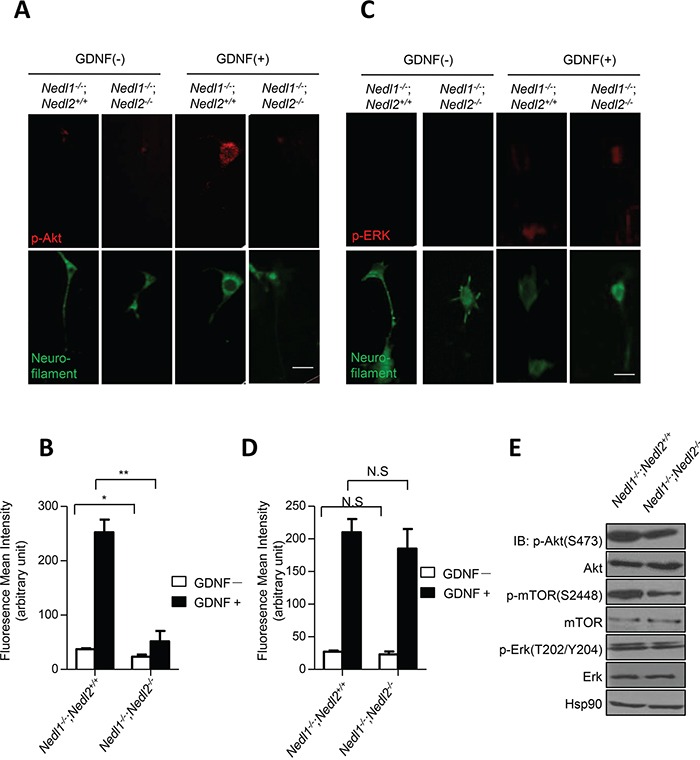
Figure 4. Suppression of GDNF/Akt signaling in Nedl1−/−;Nedl2−/− mice.

A–B. Akt phosphorylation in cultured enteric neurons derived from P9 intestine after GDNF stimulation. Cells with or without 30 min treatment of GDNF stained with anti-pAkt antibody. Scale bar: 20 μm. C-D. Erk phosphorylation in cultured enteric neurons derived from P9 colon after GDNF stimulation. Cells with or without 5 min treatment of GDNF stained with anti-pErk antibody. Scale bar: 20 μm. E. Western blot analysis of GDNF/Ret/Akt signaling pathway, fresh tissues are dissected from P9 mice. Values represent means ± s.d. (*P<0.05, **P<0.01).
