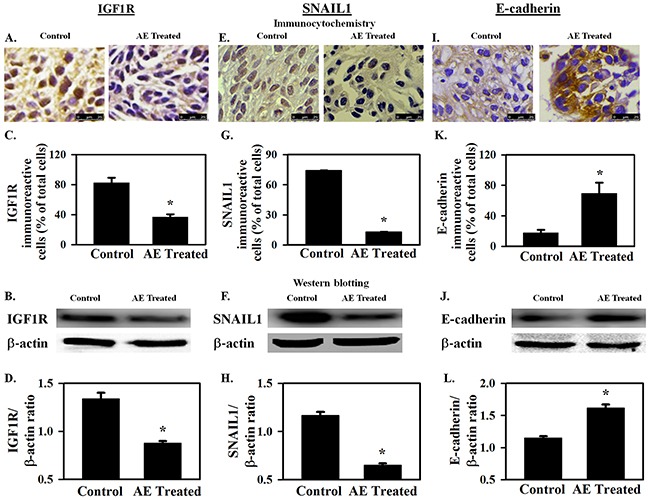
Figure 7. AE downregulates IGF1R and SNAIL1 protein expression and increases E-cadherin protein expression in SKOV3 xenograft tumors.

A–D. IGF1R protein expression. A, B. Immuno-cytochemical analysis shows decreased expression of IGF1R in xenografts from AE-treated mice. Bar graph shows the percentage of IGF1R immuno-reactive cells. C, D. Representative Western blot image showing decreased expression of IGF1R. Densitometry ratios of IGF1R/β -actin are shown. E–H. SNAIL1 protein expression. E, F. Decreased immuno-expression of SNAIL1 is observed in xenograft tumors after AE treatment. Bar graph shows SNAIL1 immuno-reactive cells as percent of total number of cells. G, H. Representative Western blot image showing decreased expression of SNAIL1. SNAIL1/β -actin densitometry ratios presented. I–L. E-cadherin protein expression. I, J. Image showing increased immuno-expression of E-cadherin in xenograft tumors after treatment with AE. Percentage of E-cadherin immuno-positive cells in control and AE treated groups is compared. K, L. Representative Western blot image shows increased expression of E-cadherin in AE treated group. Densitometric ratios of E-cadherin/β -actin are presented. All results were obtained using tumor tissues from 5 mice in each group. Values are Means ± SEM, *, P≤0.05 compared with control group. Bar=25 μm.
