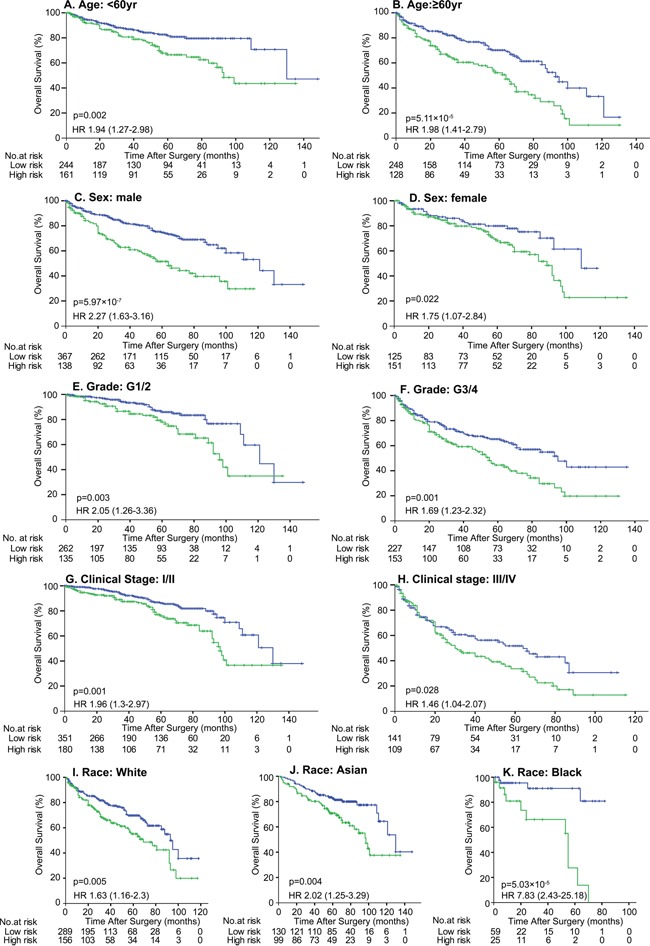
Figure 3. Kaplan-Meier survival analysis of DAB2IP CpG1 methylation in subsets of 781 patients stratified by clinicopathological risk factors.

Patients were divided into 2 groups based on DAP2IP methylation: High risk group, >50% methylation (green line) and low risk group (blue line), ≤50% methylation. p values were calculated using the log-rank test.
