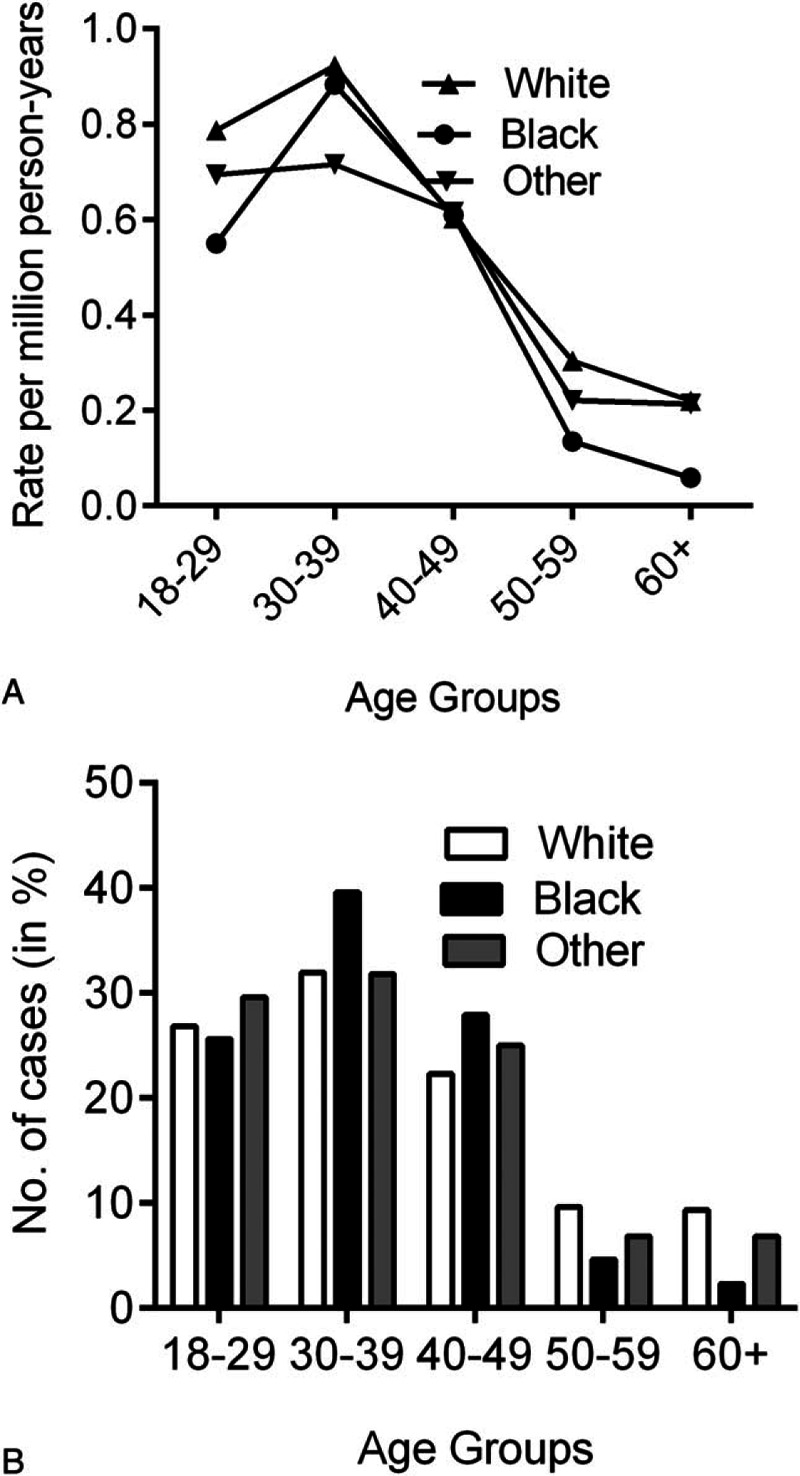
Figure 3.

Age distribution of PMBL is shown by race. (A) Age-specific incidence rates by race, SEER-18, 2001 to 2012. (B) Horizontal axis represents the grouping of age at diagnosis. Vertical axis represents the proportion of patients in each age group of that particular race (white, black, and others). PMBL = primary mediastinal large B-cell lymphoma, SEER = surveillance, epidemiology, and end results.
