
Figure 5.
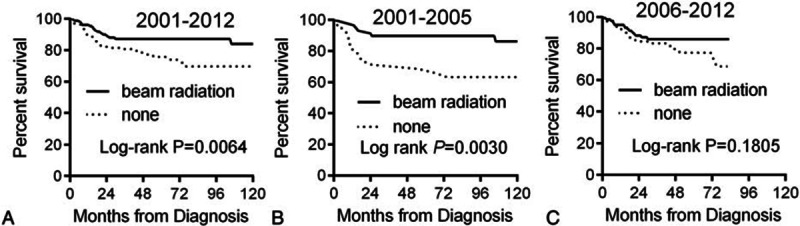
Kaplan–Meier curves for overall survival in patients received with or without radiation therapy: (A) years diagnosed 2001 to 2012; (B) years diagnosed 2001 to 2005; (C) years diagnosed 2006 to 2012.
Official websites use .gov
A
.gov website belongs to an official
government organization in the United States.
Secure .gov websites use HTTPS
A lock (
) or https:// means you've safely
connected to the .gov website. Share sensitive
information only on official, secure websites.
Kaplan–Meier curves for overall survival in patients received with or without radiation therapy: (A) years diagnosed 2001 to 2012; (B) years diagnosed 2001 to 2005; (C) years diagnosed 2006 to 2012.