
Figure 2.
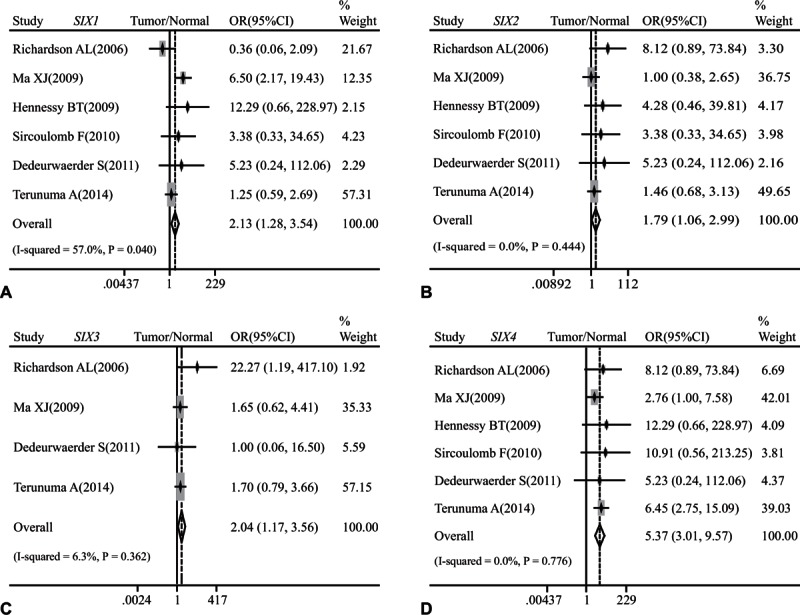
Forest plot of odds ratio (OR). CI = confidence interval. (A). Association between the mRNA expression of SIX1 and breast cancer risks in comparison to normal breast tissues. (B). Association between the mRNA expression of SIX2 and breast cancer risks in comparison to normal breast tissues. (C). Association between the mRNA expression of SIX3 and breast cancer risks in comparison to normal breast tissues. (D). Association between the mRNA expression of SIX4 and breast cancer risks in comparison to normal breast tissues.