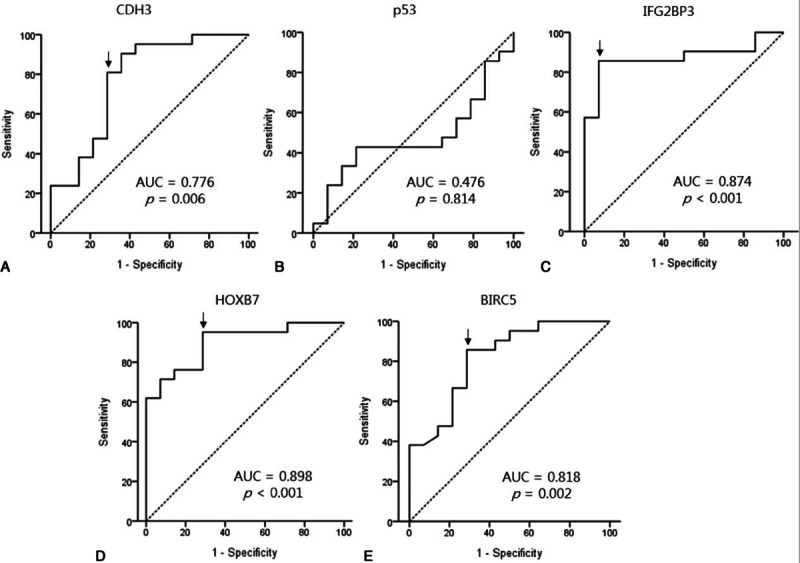
Figure 3.

Receiver-operating characteristic (ROC) curve analyses for the relative mRNA expression levels as diagnostic markers of malignancy in the biliary tract. ROC curves for CDH3 (A), p53 (B), IGF2BP3 (C), HOXB7 (D), and BIRC5 (E) were plotted. The area under the ROC curves (AUC) and P values are shown in the curves. The cut-off values (arrows) are indicated in each curve. BIRC5 = baculoviral inhibitor of apoptosis repeat containing 5, CDH3 = cadherin 3, HOXB7 = homeobox B7, IGF2BP3 = insulin-like growth factor II mRNA-binding protein 3.
