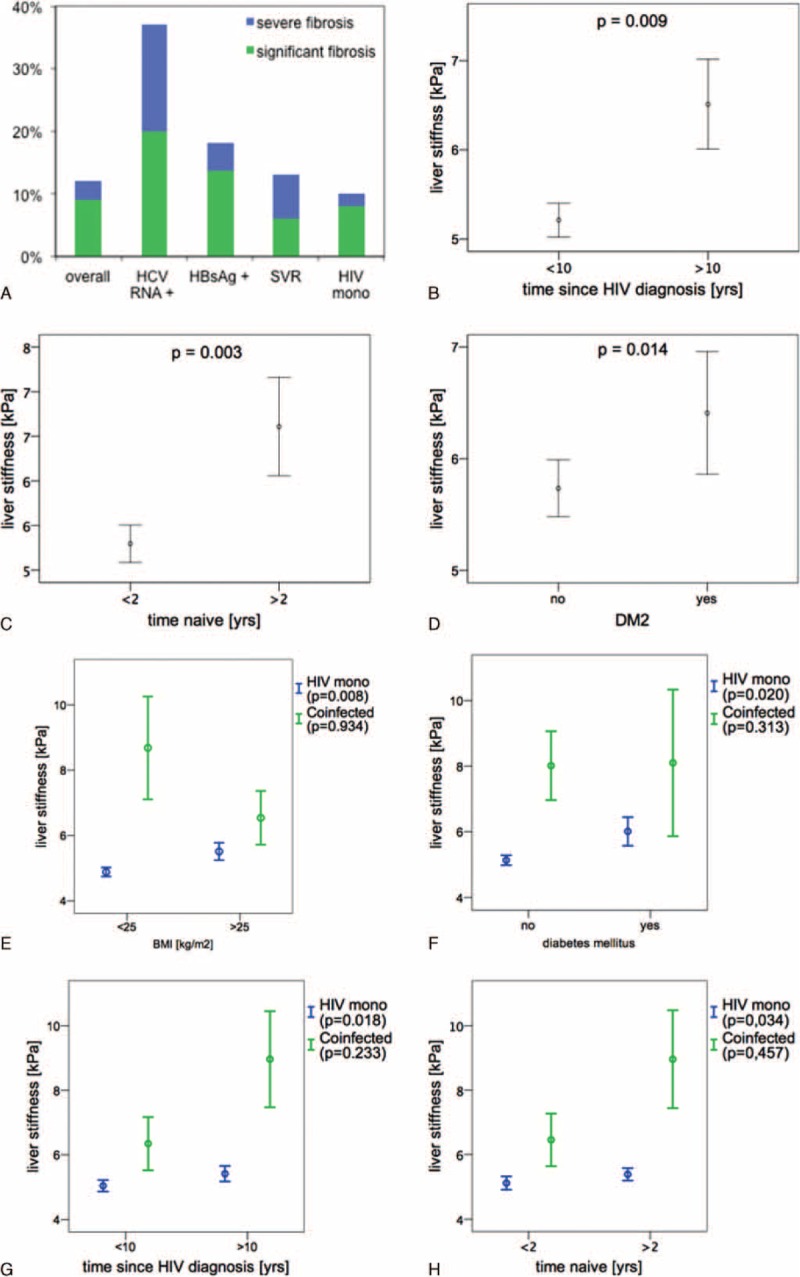
FIGURE 1.

(A) Distribution of fibrosis among subgroups. (B–D) Association between LS and HIV duration, time naive, and DM. (E–H) Association between LS and BMI, DM, HIV duration, and time naive in HIV mono-infected patients compared with coinfected patients. Data are presented as mean ± SEM. BMI = body mass index, DM = diabetes mellitus, HIV = human immunodeficiency virus, LS = liver stiffness, SEM = standard error of the mean.
