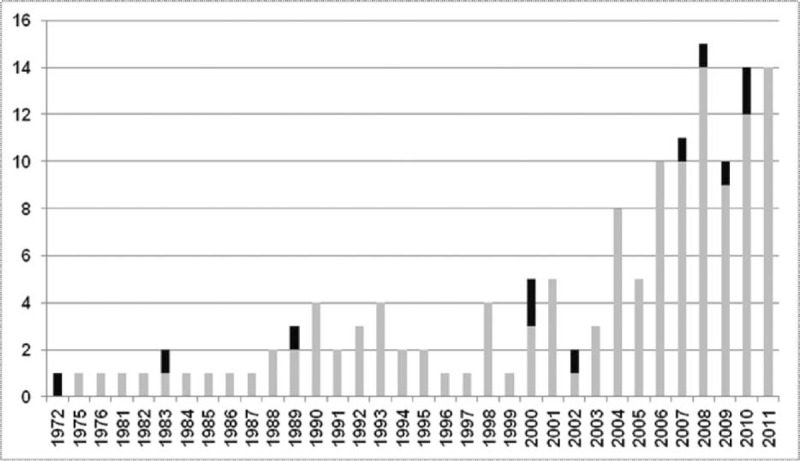
FIGURE 2.

Annual distribution of case reports included in the analysis. The 145 case reports included in the analysis are shown according to their year of publication. Among these, the 11 deaths reported are depicted in black (stacked bars) of the published cases by year. The median year of published case reports studied is 2006. Six deaths of 78 cases (7.7%) were reported between 1972 and 2006, and 5/67 (7.5%) from 2007 to 2012 (P = 0.96). The year 2012 is not represented as the collection of case reports ended in July 2012 (3 cases reports studied, no deaths).
