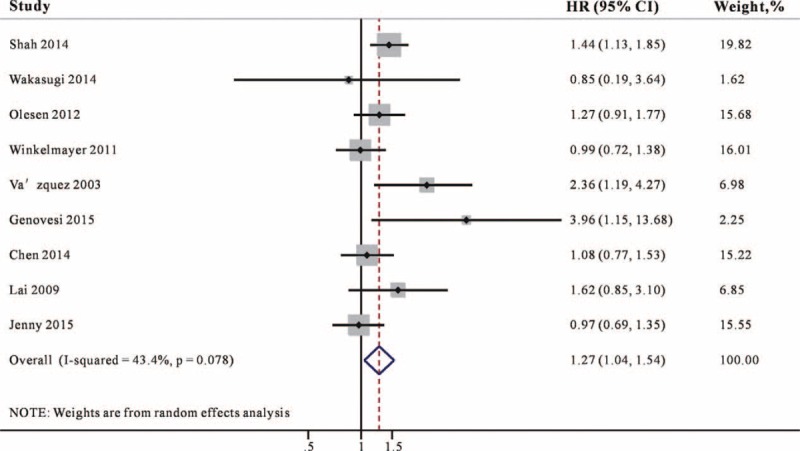
FIGURE 3.

Combined estimate of hazard ratios (HRs) and 95% confidence intervals (CIs) of warfarin use associated with bleeding risk. Squares represent the HRs (size of square reflects the study's weight), and lines represent the 95% CIs for individual studies. The diamond represents the pooled HR and 95% CI. CI = confidence intervals, HRs = hazard ratios.
