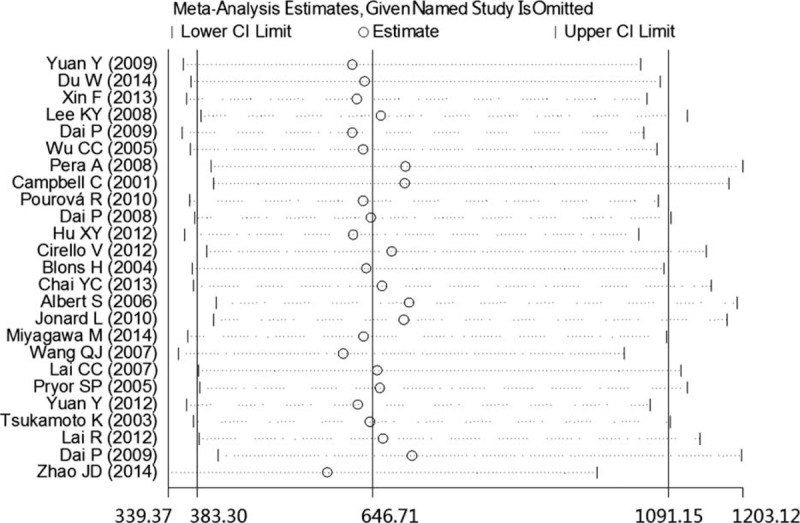
FIGURE 6.

Sensitivity analysis of the pooled SLC26A4 mutation OR influence in the deafness and control groups. The results were computed by omitting each study in turn. Meta-analysis random effects estimates (in the exponential form) were used. The 2 ends of the dotted lines represent the 95% CI. CI = confidence interval, OR = odds ratio.
