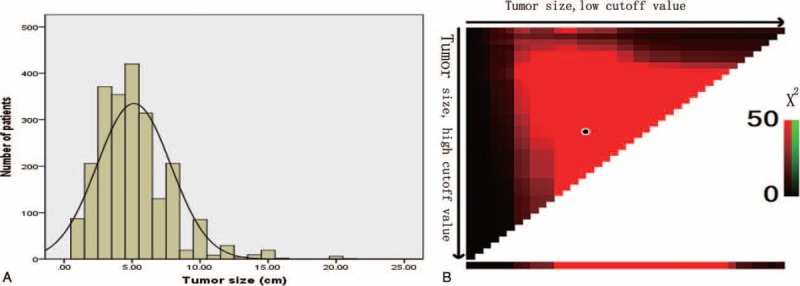
FIGURE 1.

A, The distribution of number of patients related to tumor size. Tumor size ranged from 0.5 to 21.0 cm, with a median of 5.00 cm and a mean of 5.09 ± 2.70 cm. B, X-tile plots for tumor size constructed by patients enrolled in this study. The plots show the X2 log-rank values produced, dividing them into 3 groups by 2 cutoff points. The brightest pixel represents the maximum X2 log-rank value (160.8) generated by the cutoff value (4.5 cm, 7.5 cm) as marked by the black spot.
