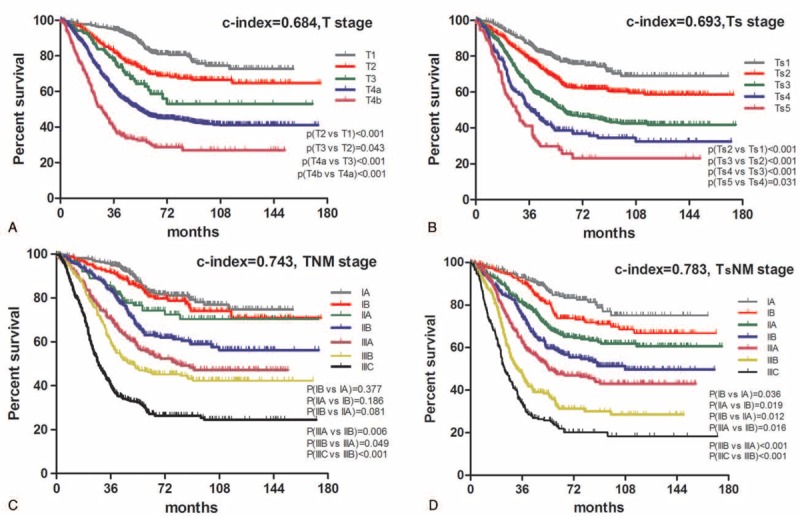
FIGURE 2.

Comparative accuracies of survival analysis. A, Survival curve of patients according to subgroups of T stage. B, Survival curve of patients according to subgroups of Ts stage. C, Survival curve of patients according to subgroups of TNM stage. D, Survival curve of patients according to subgroups of TsNM stage. The significance of difference between survival curves was determined by the log-rank test.
