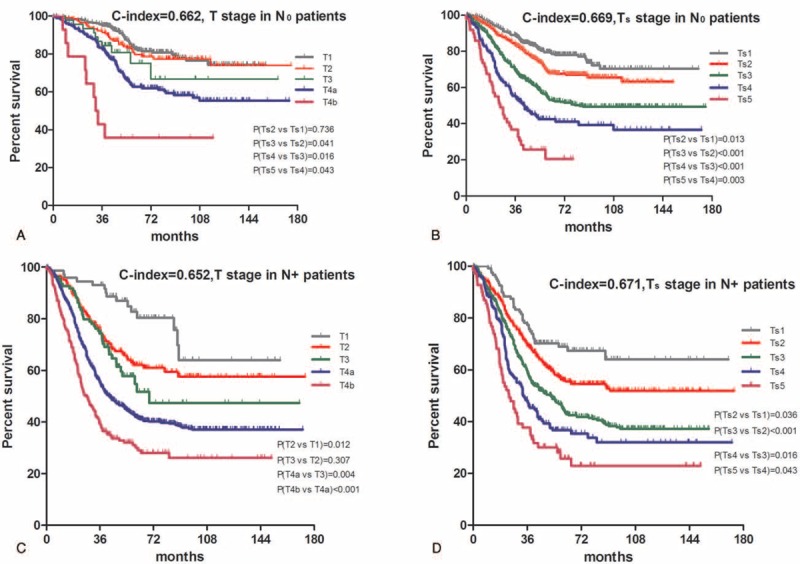
FIGURE 3.

Comparative accuracies of survival analysis between T and Ts stages in terms of the lymph node status. A, Survival curve of patients with negative lymph node metastastis (N0) according to subgroups of T stage. B, Survival curve of patients with negative lymph node metastastis (N0) according to subgroups of Ts stage. C, Survival curve of patients with positive lymph node metastastis (N+) according to subgroups of T stage. D, Survival curve of patients with positive lymph node metastastis (N+) according to subgroups of Ts stage. The significance of difference between survival curves was determined by the log-rank test.
