
FIGURE 1.
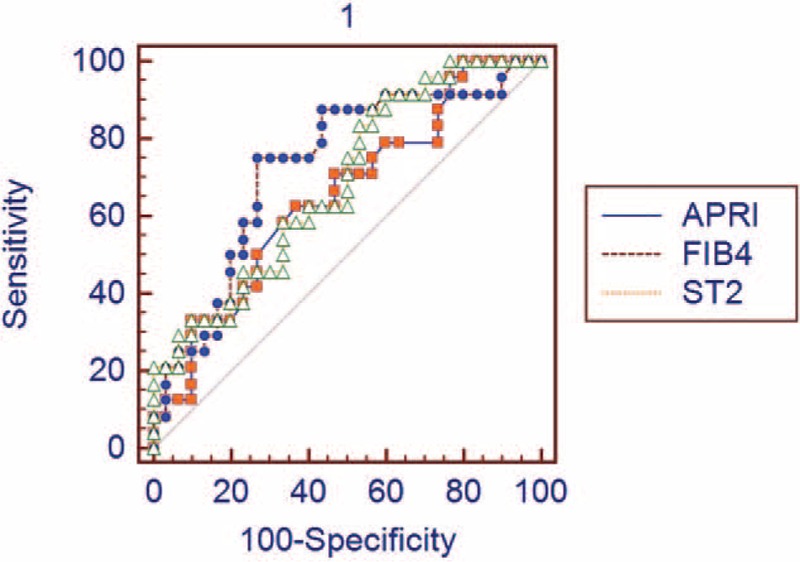
ROC curve analysis of sST2 level, APRI, and FIB-4 for the diagnosis of significant fibrosis. AUC for sST2: 0.68 (95% CI: 0.573–0.827), AUC for APRI: 0.65 (95% CI: 0.511–0.777), and AUC for FIB-4: 0.73 (95% CI: 0.593–0.843). When AUC values were compared, there was no significant difference between the models (serum sST2 vs APRI: P = 0.7, sST2 vs FIB-4: P = 0.5, APRI vs FIB-4: P = 0.1). APRI = aspartate aminotransferase-to-platelet ratio index, AUC = area under the curve, CI = confidence interval, FIB-4 = fibrosis index based on the 4 factors, ROC = receiver operating characteristics, ST2 = Soluble ST2.