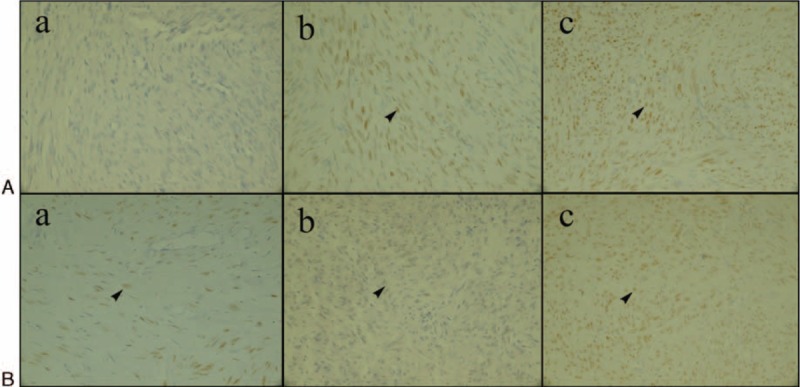
FIGURE 5.

ER/PR expression of fibroid when ablated in vivo at a temperature of 100°C (shown as arrow, ×400). (A) ER expression of fibroid ablated in vivo at a temperature of 100°C. (B) PR expression of fibroid ablated in vivo at a temperature of 100°C. (a) Group A. (b) Group B. (c) Group C. ER/PR optical density in the group A was lesser than that of group B, and the ER/PR optical density in group B was lesser than that of group C, which increased with increasing distance from the electrode.
