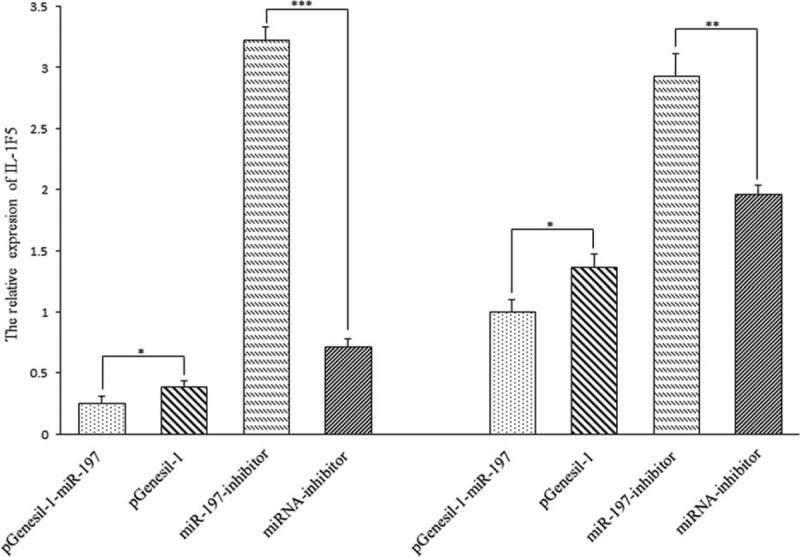
FIGURE 2.

The relative expression of IL-1F5 after transfection in SGC-7901 and BGC-823 Note: (∗: P < 0.05, ∗∗: P < 0.01, ∗∗∗: P < 0.001). IL-1F5 mRNA expression was assessed by qRT-PCR in SGC-7901 (left) and BGC-823 (right) cell lines. Data was evaluated statistically using t-test and represent the mean ± SD from the experiments in triplicate.
