
FIGURE 2.
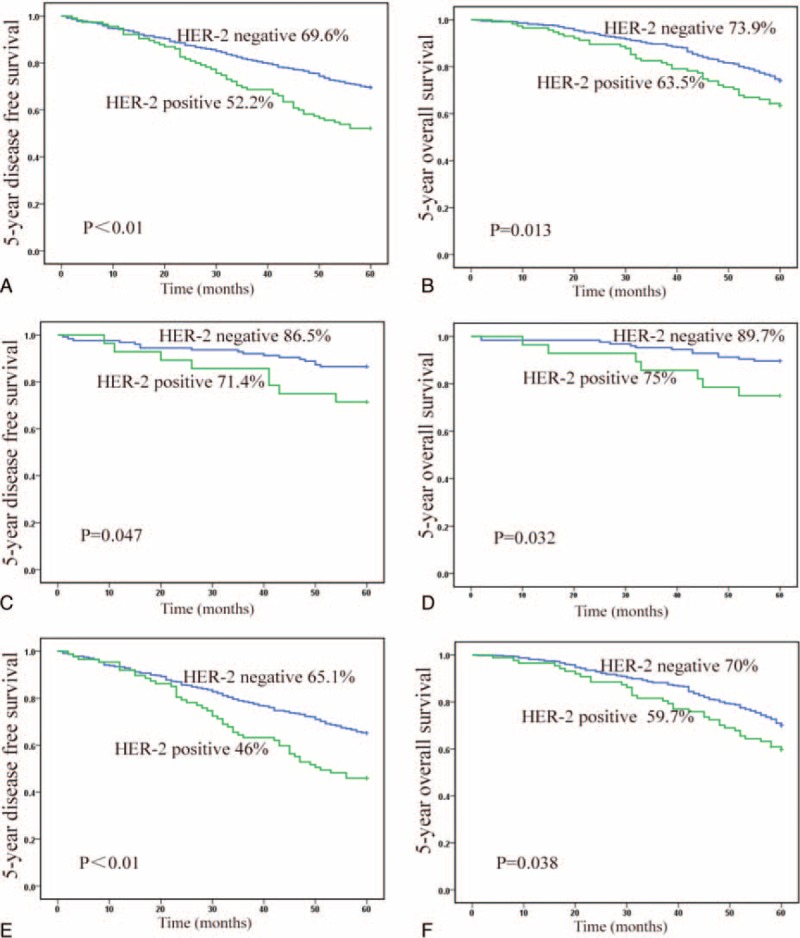
Kaplan-Meier analysis of DFS and OS rates in relation to HER-2 status: (A) HER-2 overexpression in rectal cancers is correlated with a shorter DFS curves (P < 0.001); (B) HER-2 overexpression in rectal cancers is correlated with a shorter OS curves (P = 0.013); (C) HER-2 was a poor predictor for 5-year DFS in rectal cancers at early stage (P = 0.047); (D) 5-year OS curves in patients with rectal cancer at early stage (P = 0.032); (E) HER-2 was a poor predictor for 5-year DFS in LARCs (P < 0.001); (F) 5-year-OS curves in patients with LARC (P = 0.038). DFS = disease-free survival, HER-2 = human epidermal growth factor receptor-2, LARC = locally advanced rectal cancer, OS = overall survival.