
Figure 5.
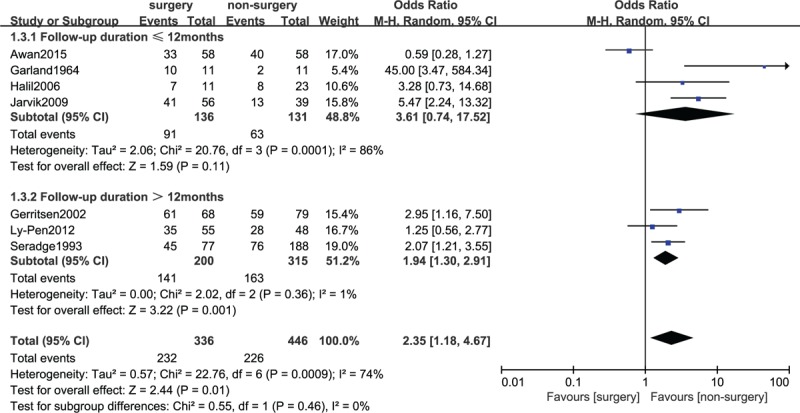
Forest plot of comparison: subgroup results of clinical efficacy by duration of follow-up (≤12 vs >12 months) between surgery group and nonsurgery group.
Official websites use .gov
A
.gov website belongs to an official
government organization in the United States.
Secure .gov websites use HTTPS
A lock (
) or https:// means you've safely
connected to the .gov website. Share sensitive
information only on official, secure websites.
Forest plot of comparison: subgroup results of clinical efficacy by duration of follow-up (≤12 vs >12 months) between surgery group and nonsurgery group.