Figure 2.

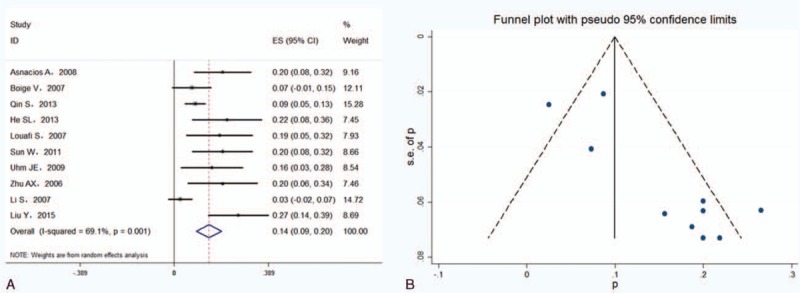
Forest plots showing objective remission rates from eligible studies in a random effects model (A) and funnel plots of objective remission rate (B).

Forest plots showing objective remission rates from eligible studies in a random effects model (A) and funnel plots of objective remission rate (B).