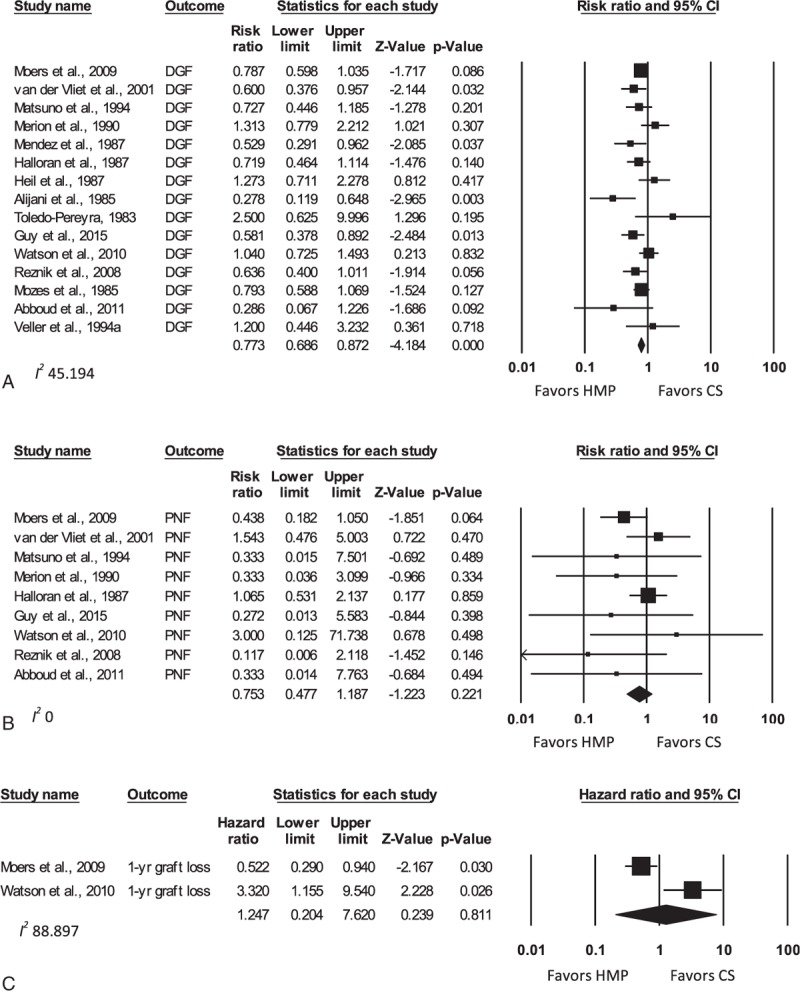
Figure 2.

Forest plots comparing DGF (A), PNF (B), and 1-year graft loss (C) for all studies comparing HMP to CS—human studies. Data expressed as RR (for DGF and PNF) and HR (for graft loss) ± 95% CI. Different analyses within the same study are denoted by an alphabetical letter suffix (e.g., “a”). CI = confidence interval, CS = cold (static) storage, DGF = delayed graft function, HMP = hypothermic machine perfusion, HR = hazard ratio, PNF = primary nonfunction.
