Figure 2.

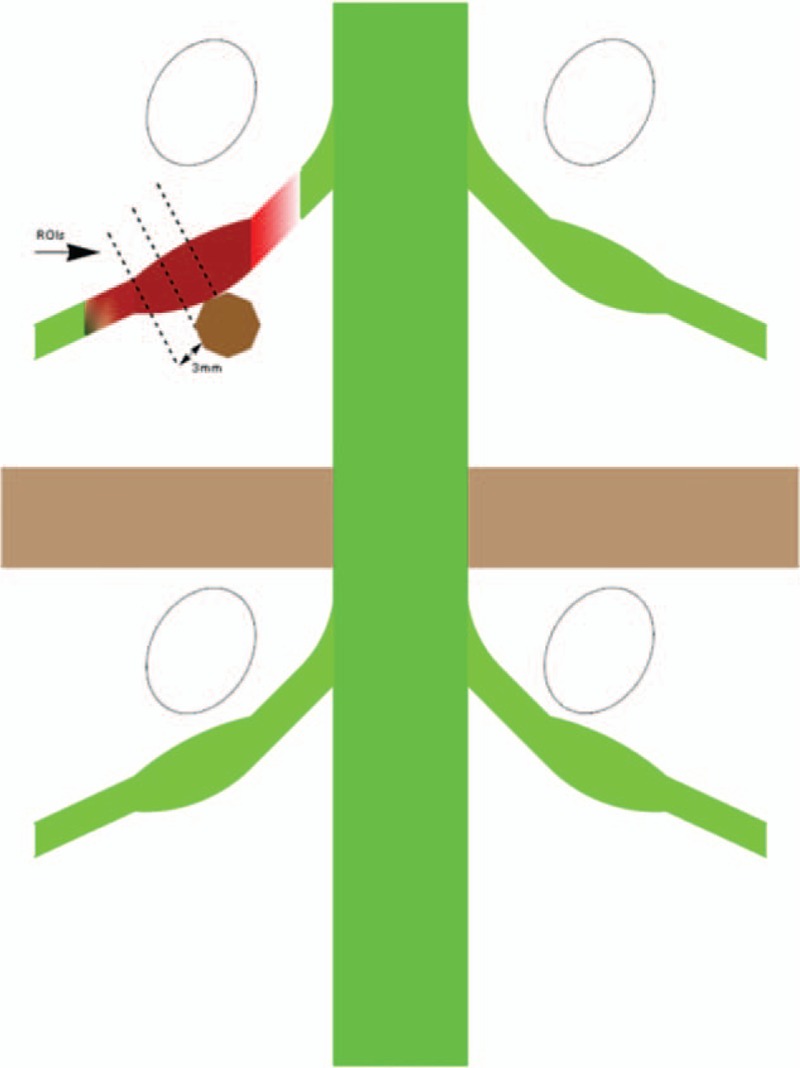
Diagram showing that the regions of interest (ROIs) were placed at 3 levels at 3-mm intervals proximal to the site of compression of the nerve by disc herniation on the axial image of the calculated.

Diagram showing that the regions of interest (ROIs) were placed at 3 levels at 3-mm intervals proximal to the site of compression of the nerve by disc herniation on the axial image of the calculated.