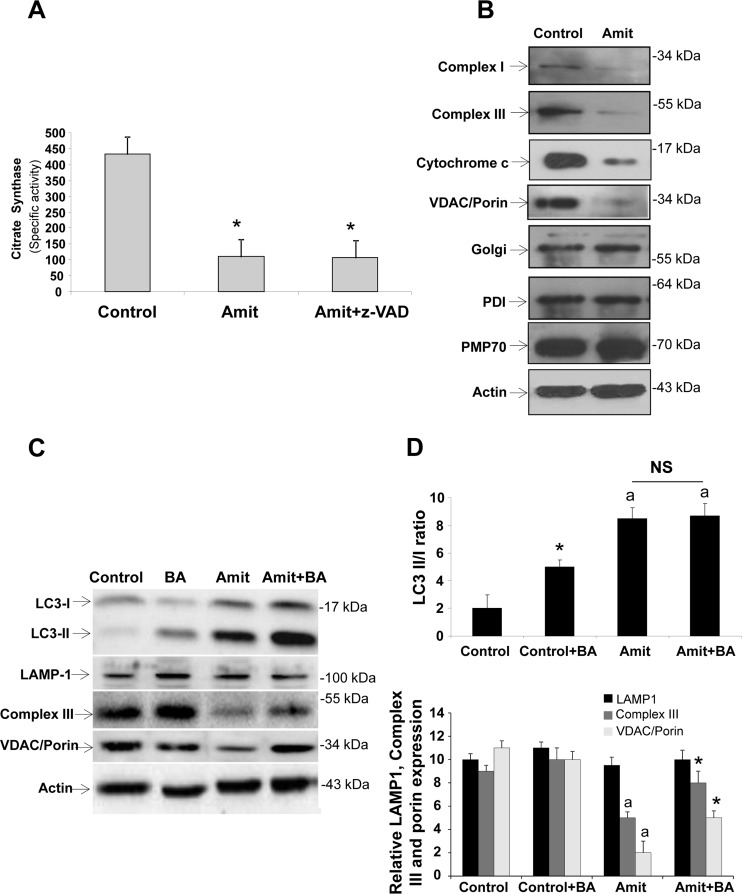
Figure 5. Mitophagy and autophagic flux in Amitriptyline-treated cells.
A. Mitochondrial mass measured by citrate synthase specific activity in control and Amitriptyline-treated (Amit) HEPG2 cells. B. Western blot analysis of mitochondrial (complex I, 30 kDa subunit; complex III, core 1 subunit; and VDAC/Porin), Golgi (Golgi marker), endoplasmic reticulum (PDI), and peroxisome (catalase) proteins in HepG2 cells treated with Amitriptyline (50μM) for 12 h. Actin was used as loading control. C. Autophagic flux. Determination of LC3B II, LAMP-1, complex III (core 1 subunit) and VDAC/Porin expression levels in the presence and absence of 20 nM bafilomycin A1 (BA) for 6 h in HepG2 cells treated with Amitriptyline (50μM) for 12 h. Total cellular extracts were analyzed by Western blotting. Actin was used as a loading control. D. Densitometry of LC3B II, LAMP-1, complex III (core 1 subunit) and VDAC/Porin. Data represent mean±SD of 3 separate experiments. *p < 0.01 vs. no bafilomycin A1 treatment; ap < 0.01 vs. control. NS = not significant.

