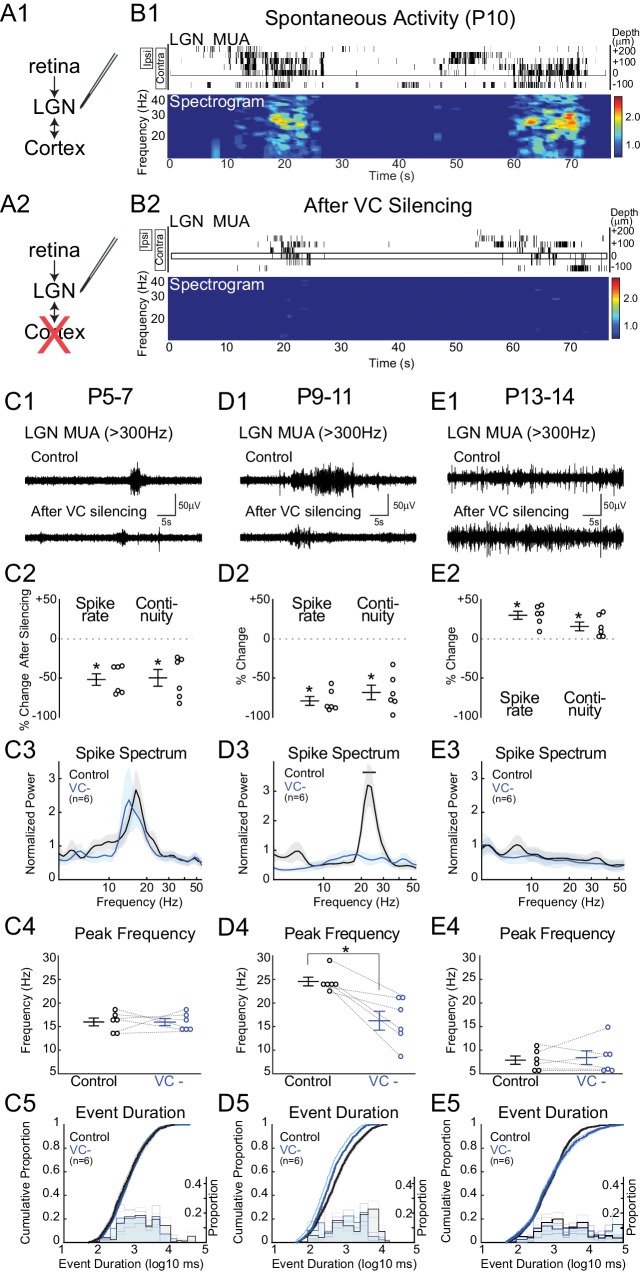
Figure 3. Corticothalamic feedback amplifies retinal waves in thalamus.
(A) Experimental set-up: silencing VC with local application of APV and CNQX while recording in LGN. (B) Representative spontaneous activity in LGN before (B1) and after VC silencing in a P10 rat (B2). LGN MUA rasters and spike-rate spectrogram as for Figure 1. (C1) Representative LGN MUA (>300 Hz) before (control) and after VC silencing at P5-7. (C2) Percent change in multi-unit spike rate and continuity of activity after VC silencing during cholinergic retinal waves (P5-7). VC silencing reduces LGN spiking as early as P5 (n = 6 each, Wilcoxon signed-rank test for difference from pre-silencing, p=0.0313, p=0.0313). (C3) Population mean of normalized LGN spike spectra. Note no change in frequency distribution despite decreased spike rates at P5-7 (permutation test, p>0.05 at all frequency ranges). (C4) Peak of spike frequency distribution (Wilcoxon signed-rank test, p=0.8750). (C5) Event duration distributions before and after VC silencing (n = 1727 and 728, two sample KS test, p=0.1975). (D) Effects of VC silencing during glutamatergic waves (P9-11) (n = 6). (D1–5) as for C1–5 (D2: Wilcoxon signed-rank test, p=0.0313, p=0.0313; D3: permutation test, p<0.05 between 19.8–27.2 Hz; D4: Wilcoxon signed-rank test, p=0.0313; D5: n = 1549 and 773, two sample KS test, p=10–9). Note large decrease in spindle-oscillation power and peak frequency in LGN following VC silencing. (E) Effects of VC silencing after retinal wave period (P13-14) (n = 6). (E1–5) as for C1–5 (E2: Wilcoxon signed-rank test, p=0.0313 p=0.0313; E3: permutation test, p>0.05 at all frequency ranges; E4: Wilcoxon signed-rank test, p=0.8750; E5: n = 1785 and 1129, two sample KS test, p=0.0029). Note absence of effect on spike spectra, and increase, in contrast to the decreases until P11, in spike rate, continuity and event duration in LGN following VC silencing at P13-14.

