. 2016 Sep 19;5:e19127. doi: 10.7554/eLife.19127

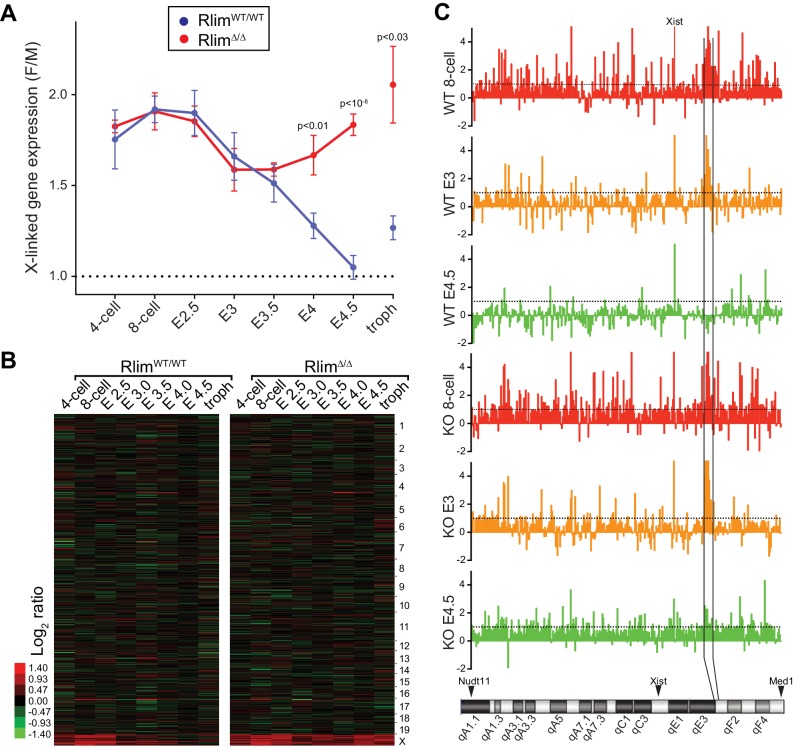
Figure 3. Rlim is required for X-silencing in females during blastocyst stages.

Female expression data collected from RlimWT/WTor RlimΔ/Δ were compared with those of male (pooled KO and WT) embryos (F/M). Embryonic stages are indicated, troph = trophoblasts. (A) Developmental profile of X-silencing during iXCI in vivo as determined by comparing mean female/male (F/M) expression ratios of X-linked transcripts (minus Xist; in Fragments per kilobase of exon per million reads mapped (FPKM)). Error bars indicate SEM. Significant p values p<0.01 are indicated (Student’s t-test). (B) Heat map representing Log2 transformed data comparing global F/M mRNA expression level ratios from chromosomes (excluding the Y) of WT and KO embryos. Chromosomes corresponding to gene expression are indicated. (C) Gene silencing during iXCI occurs within most regions on the X chromosome. Log2 F/M ratios of 351 X-linked genes at the 8-cell stage, E3 and E4.5 in WT and RlimKO are shown (values within 4.5 and -2). Horizontal dotted lines indicate Log2 values of 1. The mouse X chromosome is shown below. Arrowheads indicate locations of the most centromeric (Nudt11) and most telomeric (Med1) genes included in this analysis. Expression and location of Xist is indicated. Expression of genes within a region indicated by vertical black lines is silenced late at blastocyst stages during iXCI.

DOI: http://dx.doi.org/10.7554/eLife.19127.006

Figure 3.

Figure 3—figure supplement 1. Rlim is required for X-silencing in female blastocysts. .

Figure 3—figure supplement 1.

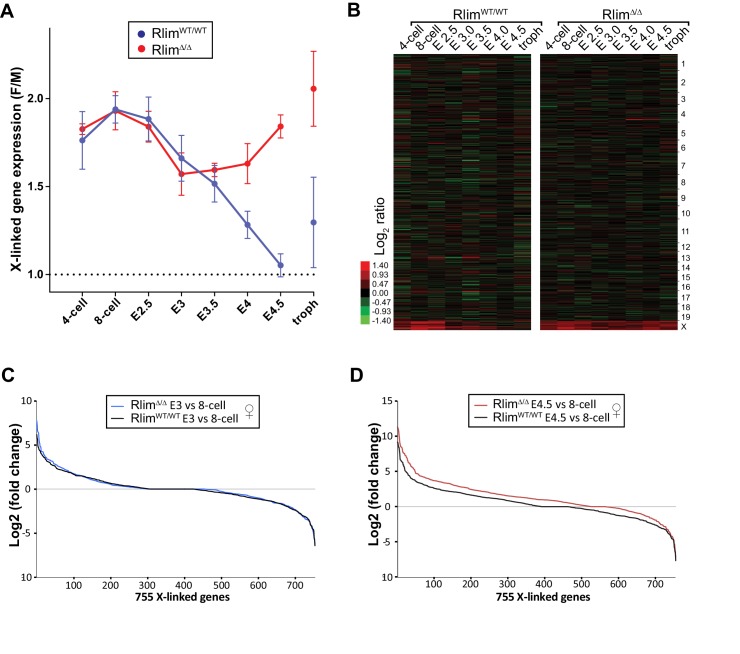
(A, B) Random downsizing each library to 200.000 reads does not significantly change/affect results obtained by RNA-seq. Representative results (n = 3) obtained from the WT/RlimKO dataset with each library randomly adjusted to 200k reads. F/M profile of X-linked gene expression (A). Heat map F/M of Log2 transformed data (B). Error bars indicate SEM. (C, D) Expression ratio distributions of 755 X-linked genes in WT/WT and RlimΔ/Δ females. 755 X-linked genes with cpms >1 in at least 3 samples of 8-cell, E3.0 and E4.5 stages of WT/WT and RlimΔ/Δ female embryos were selected, normalized to autosomal gene expression prior to calculating the Log2 fold-changes of E3 versus 8-cell (C) and E4.5 versus 8-cell stages (D).
Figure 3—figure supplement 2. Comparison of X dosage compensation using F/M or allelic approach.

Figure 3—figure supplement 2.

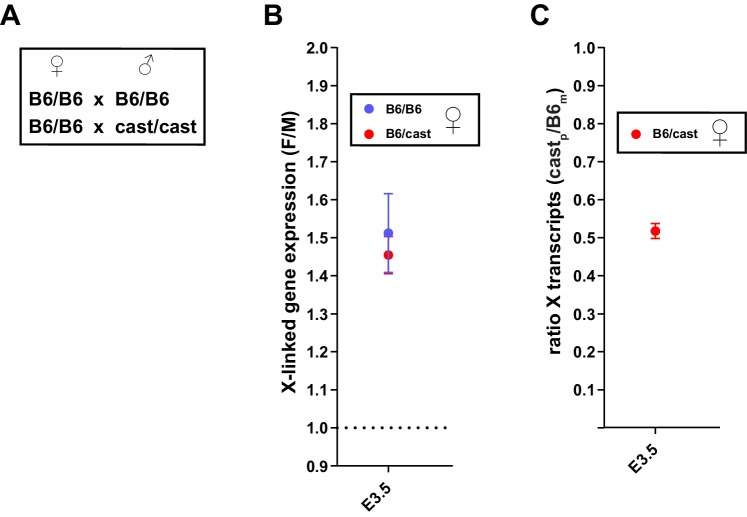
Analyses of whole embryo RNA-seq data of B6/cast heterozygous embryos in B,C were carried out on 3 male and 3 female embryos at E3.5. (A) Parental genotypes, all WT for Rlim, used for generating embryos with B6/B6 congenic genetic background and B6/CAST heterozygous genetic background. (B) Similar F/M values for B6/B6 and B6/CAST at E3.5. B6/B6 values (blue) were taken from Figure 3A. F/M values for B6/cast animals were calculated as those described in Figure 3A. (C) Analysis of allelic expression of X linked transcripts in B6/CAST heterozygous females. Note that in female embryos transcripts originating from Xp are silenced to about 50% when compared to the Xm.