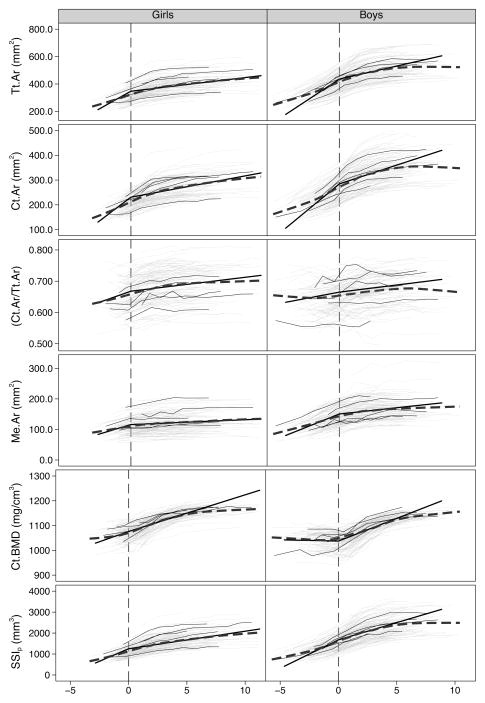
Figure 2.
Individual growth curves (thin, light gray lines), individual growth curves of five randomly selected girls and boys (thin, black lines), a lowess-smoothing curve (thick, dark gray dashed line) and the piecewise linear regression curves (thick, black line) of total area (Tt.Ar), cortical area (Ct.Ar), ratio of Ct.Ar to Tt.Ar (Ct.Ar/Tt.Ar), medullary canal area (Me.Ar), cortical bone mineral density (Ct.BMD) and polar strength-strain index (SSIp), plotted against maturity offset. The vertical line indicates maturity offset (years from age at peak height velocity) of 0.

